Climate Matters•November 18, 2020
Winter Package

NOTE: Climate Central decided to share our winter package weeks ahead of meteorological winter (December 1st) since many meteorologists are making their winter forecasts and requested updated winter data.
KEY CONCEPTS
Although cold weather still happens in a warming climate, the winter season is less cold than it was half a century ago and is the fastest-warming season in a majority of the U.S states.
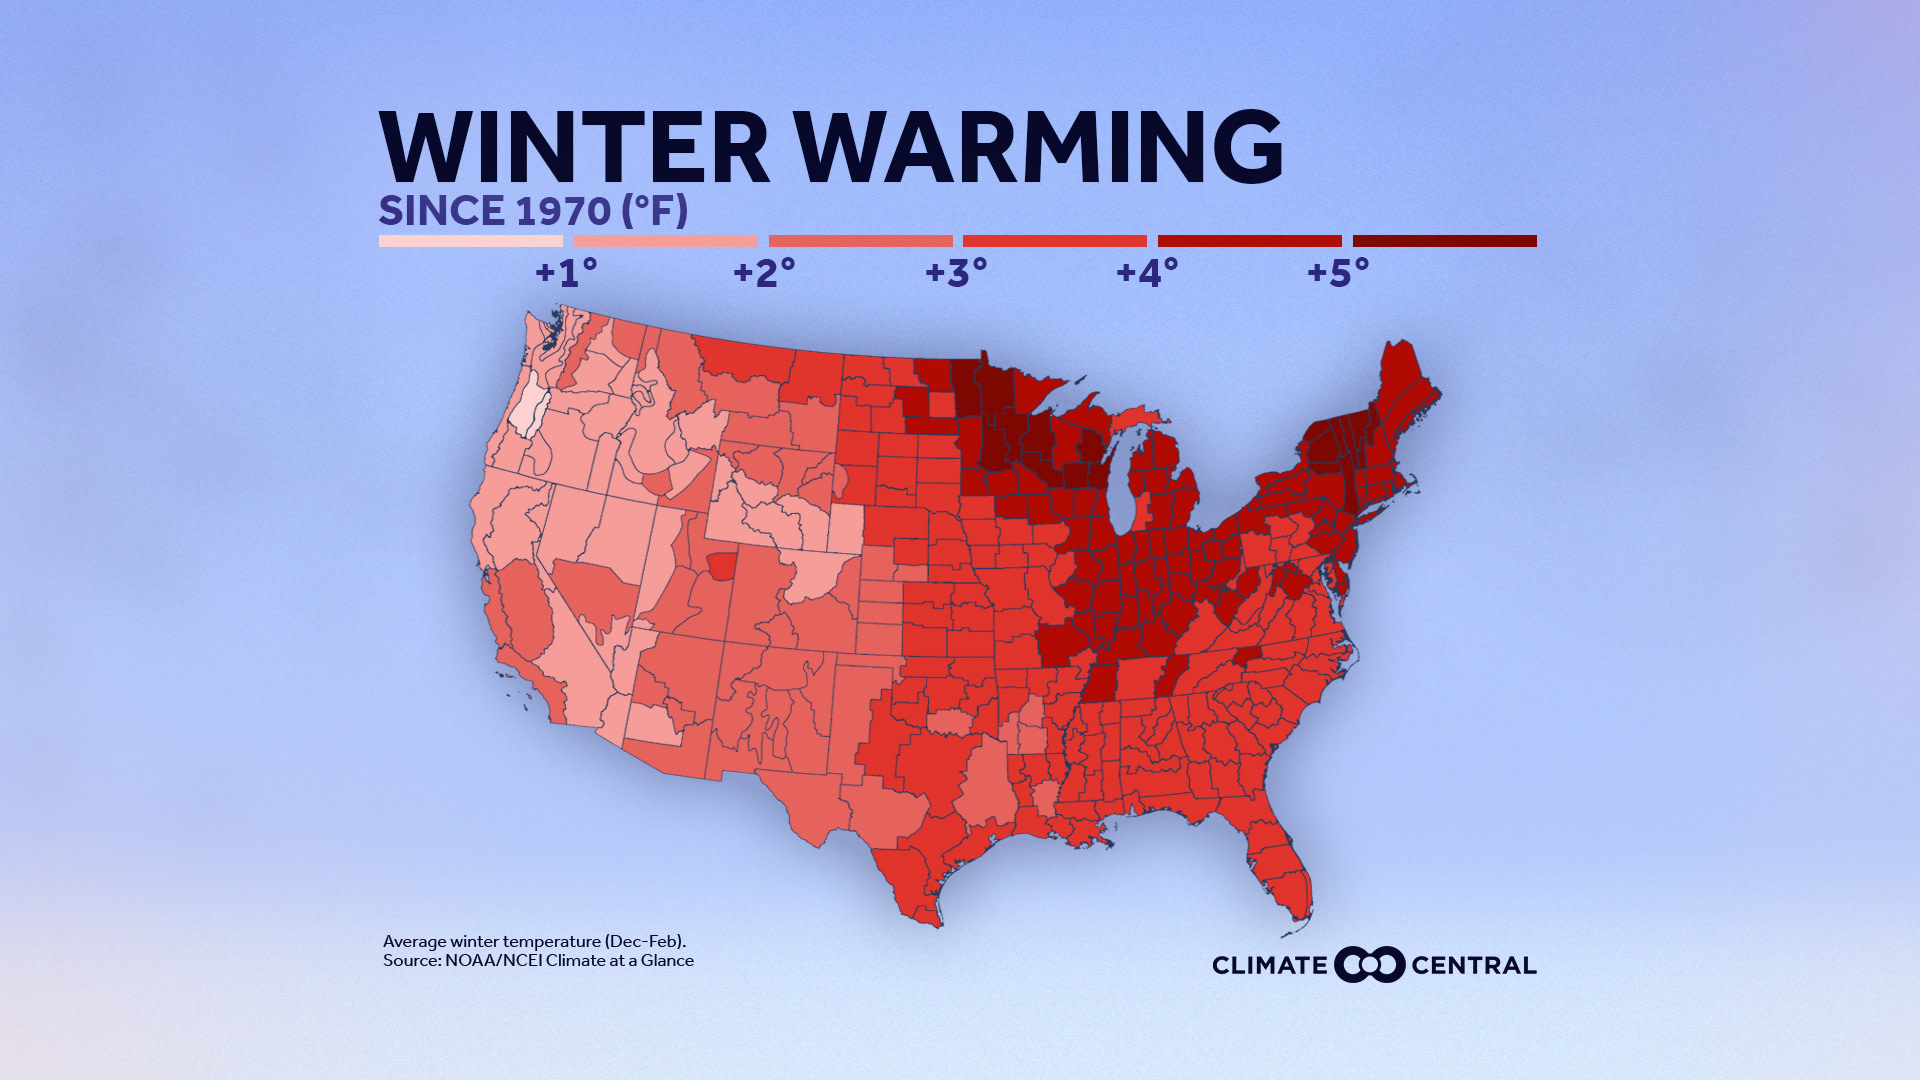
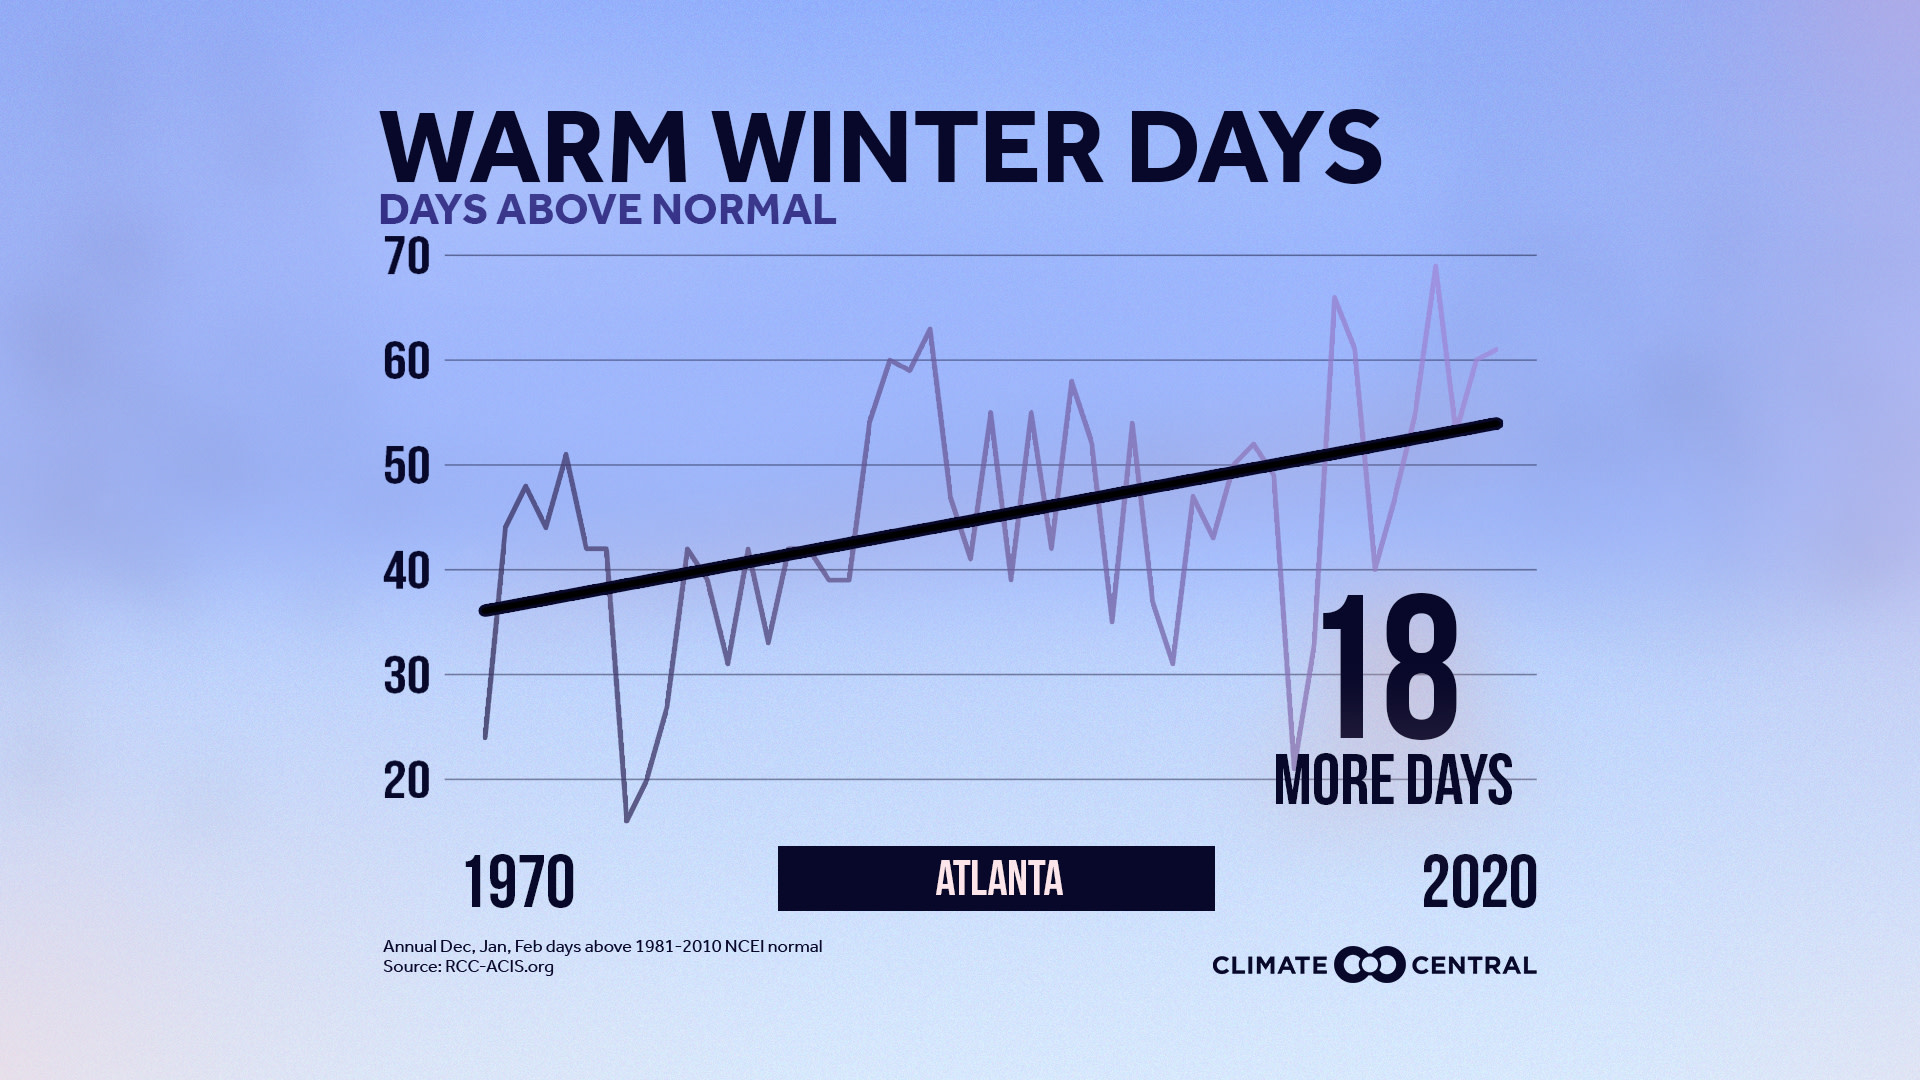
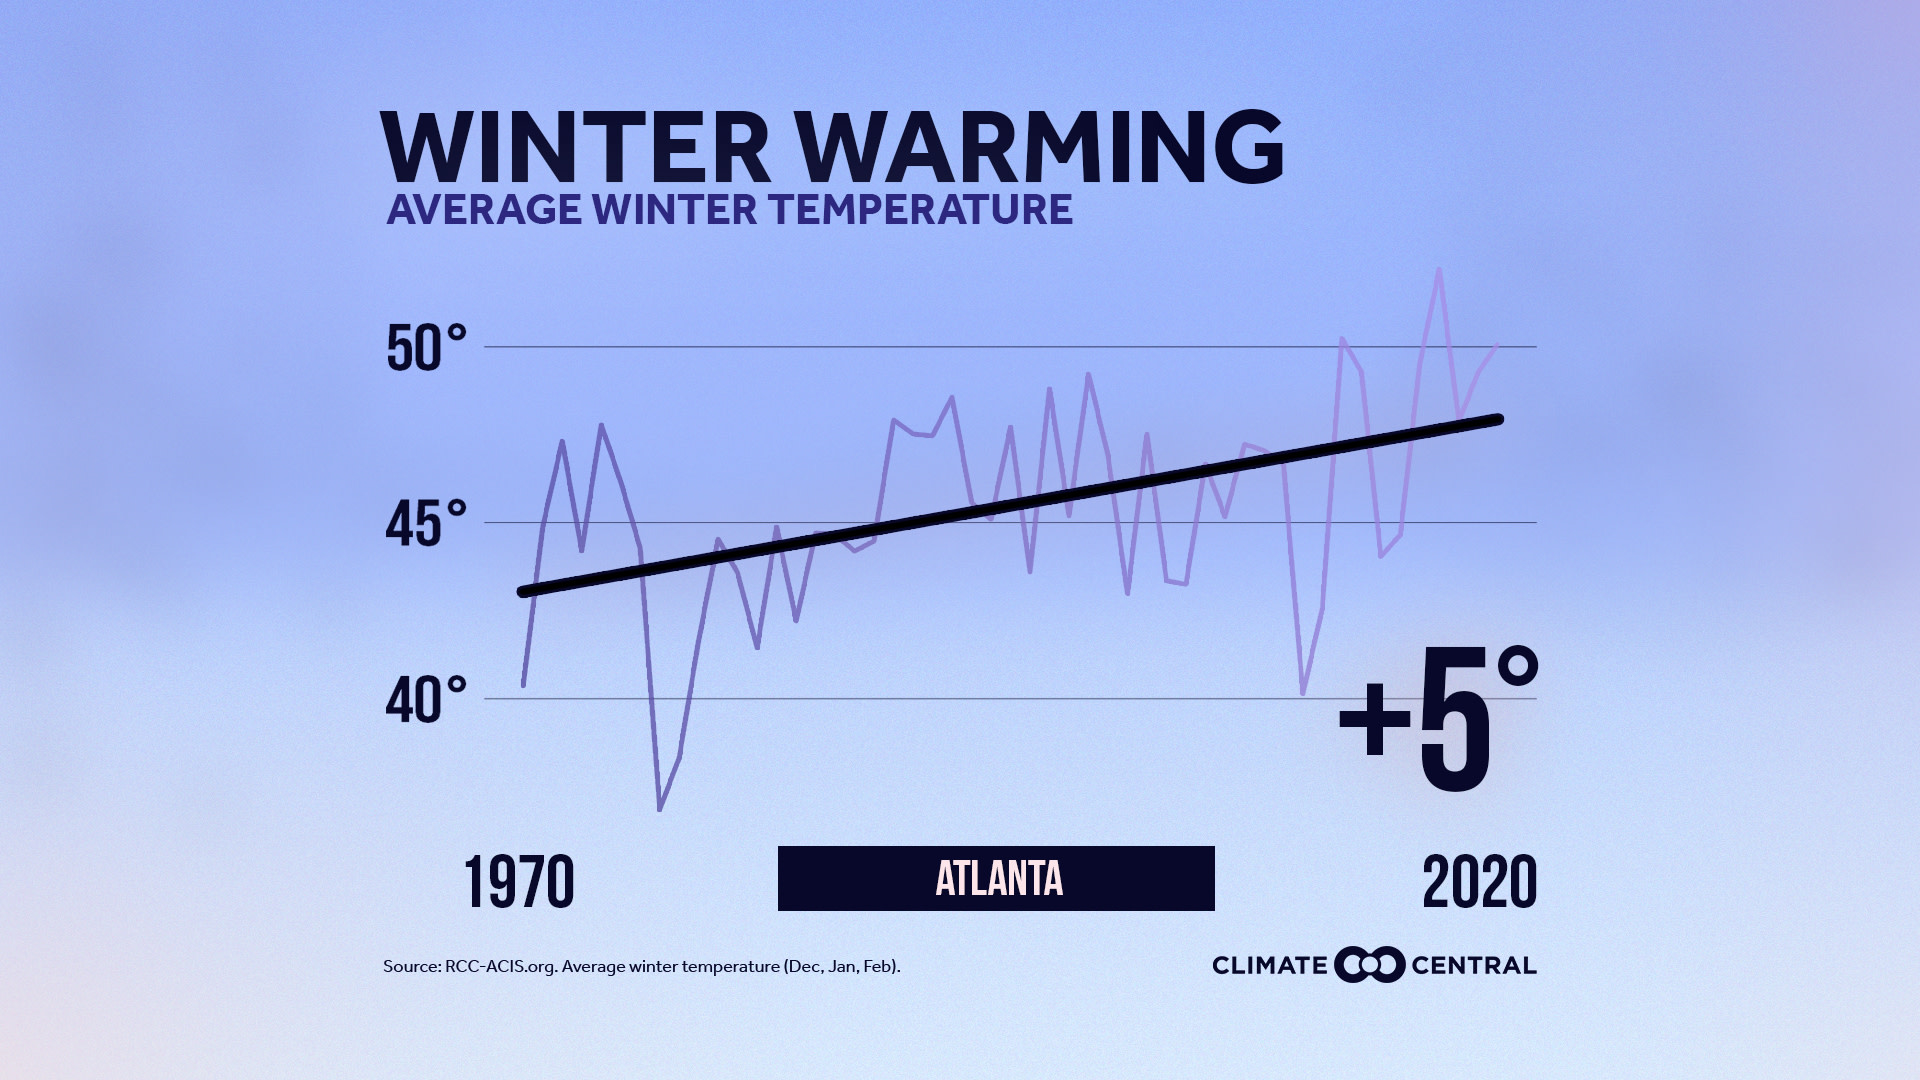
An analysis of winter temperatures indicates that 98% (236) of 242 cities had an increase in average winter temperatures from 1970, with the highest increases around the Great Lakes and Northeast region. Plus, 74% (179) recorded at least seven additional days of above-normal temperatures between 1970 and 2020.
Akin to a warming fall season, a warmer winter can have negative impacts. For instance, less snow accumulation in certain areas can threaten skiing, snowmobiling, and other winter sports-based economies. Also, the winter’s chill period is shrinking, hurting the development of fruit trees like peaches and cherries.
Find All Image Types Here (JPG & PNG)
There is no question that it still gets cold in a warming climate—just this past October, multiple locations across the Northern U.S. broke cold and snow records—but the winter season is less cold than it used to be a half-century ago. Furthermore, it is the fastest-warming season in 38 out of 49 states. This may sound inviting to folks that love warmer weather, but a warming winter comes with consequences.
This week, Climate Central analyzed winter temperatures across the country. Of the 242 cities analyzed, 98% (236) had an increase in average winter temperatures from 1970, with 86% (204 of 236) of those cities warming by 2°F or more. There is also a warming trend in the number of winter days reaching above-normal temperatures. Of 242 cities, 74% (179) reported an increase of at least 7 days—one week—of above-normal winter temperatures between 1970 and 2020. Overall, winter temperatures increased the most around the Great Lakes and Northeast region, which is consistent with where the winter season is warming the fastest.
A warmer winter can have negative impacts on humans, especially economically. For instance, a warmer winter threatens winter sports, like snowboarding and skiing, because of less snow accumulation and conditions that are too warm for snowmaking. Furthermore, ice fishing, a part of the culture in some Northern tier states, faces significant lake ice cover loss in the future. According to a 2018 report on the 2015-2016 skiing and snowmobiling season, these industries generated $11 billion to the U.S. economy and supported over 190,000 jobs—often in rural areas. The winter sports industry will be negatively impacted by climate change. The severity of those impacts will be driven by the amount of greenhouse gas emissions now and in the near future.
In addition to the winter sports industry, a warmer winter can also impact fruit production. Cherry, apple, and peach trees require a minimum number of winter chill hours before they can develop fruit in the subsequent spring and summer months. In a warming climate, the winter’s chill period is decreasing and could eventually become insufficient for fruit development in the areas where the trees are currently planted. For example, the “Peach State” of Georgia is facing peach production challenges to its iconic fruit.
POTENTIAL LOCAL STORY ANGLES
What’s the snow forecast in your area?
The National Weather Service’s Winter Page provides maps and forecasts for snow and ice in your area. Their Winter Weather Desk provides twice-daily updated forecasts for snow, freezing rain, and other wintry conditions around the country. You can also see snow reports at specific ski resorts here.
How is climate change impacting winter activities near you?
For more general information on climate change and the snow sports industry, check out Climate Central’s On Thin Ice report, Protect Our Winters website, or this Climate and Skiing report from NOAA. For more region specific data, the National Ski Areas Association (NSAA) has a list of different industry statistics to analyze.
How will warming winters affect agriculture in your area?
Look up local projections of the climate and crops with the Climate Toolbox. You can calculate how many chill hours are projected in your specific location (make sure to change the data to “chill” and set your location). You can also look at local crop suitability, calculated from multiple parameters including chill accumulation.
LOCAL EXPERTS
The SciLine service, 500 Women Scientists or the press offices of local universities may be able to connect you with local scientists who have expertise on warming winters in your area. The American Association of State Climatologists is a professional scientific organization composed of all 50 state climatologists. For more information on fruit production or snow sports, reach out to your local farmer or ski resort.
NATIONAL EXPERTS
Lauren Parker
Coordinator, USDA California Climate Hub
Postdoctoral Fellow, UC Davis John Muir Institute of the Environment
Lead Author, Warming Winters Reduce Chill Accumulation for Peach Production in the Southeastern United States
Discussion Topics: fruit production and winter chill; climate change & cold hardiness zones; climate change & geographic site suitability; climate change and fruit & nut crop phenology
leparker@ucdavis.edu
Michael Notaro, Ph.D.
Associate Director and Senior Scientist
Nelson Institute Center for Climatic Research, University of Wisconsin-Madison
Discussion Topics: lake-effect snow in Great Lakes Basin, changing lake temperatures and ice cover, and future changes in North American snowfall
mnotaro@wisc.edu
Mario Molina
Executive Director, Protect our Winters
Discussion topics: winter sports industry and climate change
Media contact: Sam Killgore, sam@protectourwinters.org, 206-310-5393
*Available for interviews in Spanish and English
METHODOLOGY
Average temperatures and days above normal were calculated for each winter (December, January, February) from 1969-70 to 2019-20 using data obtained from the Applied Climate Information System. Winter days above normal are defined as the number of days where the average temperature was above the 1981-2010 NOAA/NCEI climate normal. Climate Central's local analyses include 244 stations. However, for data summaries based on linear trends, only 242 stations are included due to large data gaps in St. Johnsbury, Vt. and Wheeling, W. Va.