Climate Matters•March 23, 2022
WeatherPower Year in Review
KEY CONCEPTS
Climate Central’s new report, WeatherPower Year in Review, analyzes when and where the most wind and solar energy was produced in the U.S. in 2021.
The contiguous U.S. generated an estimated 606,000 GWh of wind and solar electricity in 2021, up to 16% of electricity consumed.
Wind energy accounted for 73% of the total, and peaked in December. Solar peaked in July.
In terms of total generation, Texas was the top wind state with 113,000 GWh (about a quarter of the national total). California led for solar with 55,000 GWh (about a third of the national total).
Despite strong growth in wind and solar, faster rates of production are needed between now and 2030 to reach U.S. energy goals.
As the largest source of heat-trapping emissions, the energy sector (including electricity, heat, and transportation) is key to addressing climate change.
Achieving the global goal of limiting warming to 2 °C and pursuing a safer 1.5 °C limit requires halving global emissions by 2030 and reaching ‘net zero’ (removing surplus emissions from the air) by 2050.
And this, in turn, means a rapid shift toward renewable energy. To reach the 1.5 °C goal, renewables would need to generate almost 90% of global electricity by 2050, according to the International Energy Agency.
The transition to cleaner, healthier, and safer energy supplies is underway in the U.S. Climate Central’s new WeatherPower Year in Review report analyzes when and where the most wind and solar electricity was produced in 2021, and puts this in context of the nation’s net zero goals. We share some highlights from the report below.
But first: what is WeatherPower?
Climate Central’s WeatherPower tool forecasts daily local wind and solar electricity generation using:
installed capacity (the maximum potential output of electricity from wind and solar utilities) and
weather data (specifically, wind speed and solar irradiance at the Earth’s surface, which fluctuate across regions, seasons, and times of day).
Check your local WeatherPower forecast and learn more about the tool here.
Total wind and solar energy generation in 2021
WeatherPower reports electricity generation in megawatt-hours (MWh). One MWh equals 1,000 kilowatt-hours (kWh), and 1,000 MWh equals one gigawatt-hour (GWh). For reference, the average American household consumes 10.7 MWh of electricity each year.
According to WeatherPower Year in Review, the contiguous U.S. generated 606,000 GWh of electricity from wind and solar combined, which accounts for up to 16% of electricity consumed in 2021. Wind power accounted for 73% of the total (444,000 GWh). Solar produced the remaining 27% (162,000 GWh).
Peak 2021 production
Wind energy production is highest during the spring and fall. The peak day for wind electricity generation (1,750 GWh) was December 12, 2021. Solar energy production is highest in the summer when days are long and the sun’s rays strike the U.S. more directly. The peak day for solar electricity generation (619 GWh) was July 22, 2021.
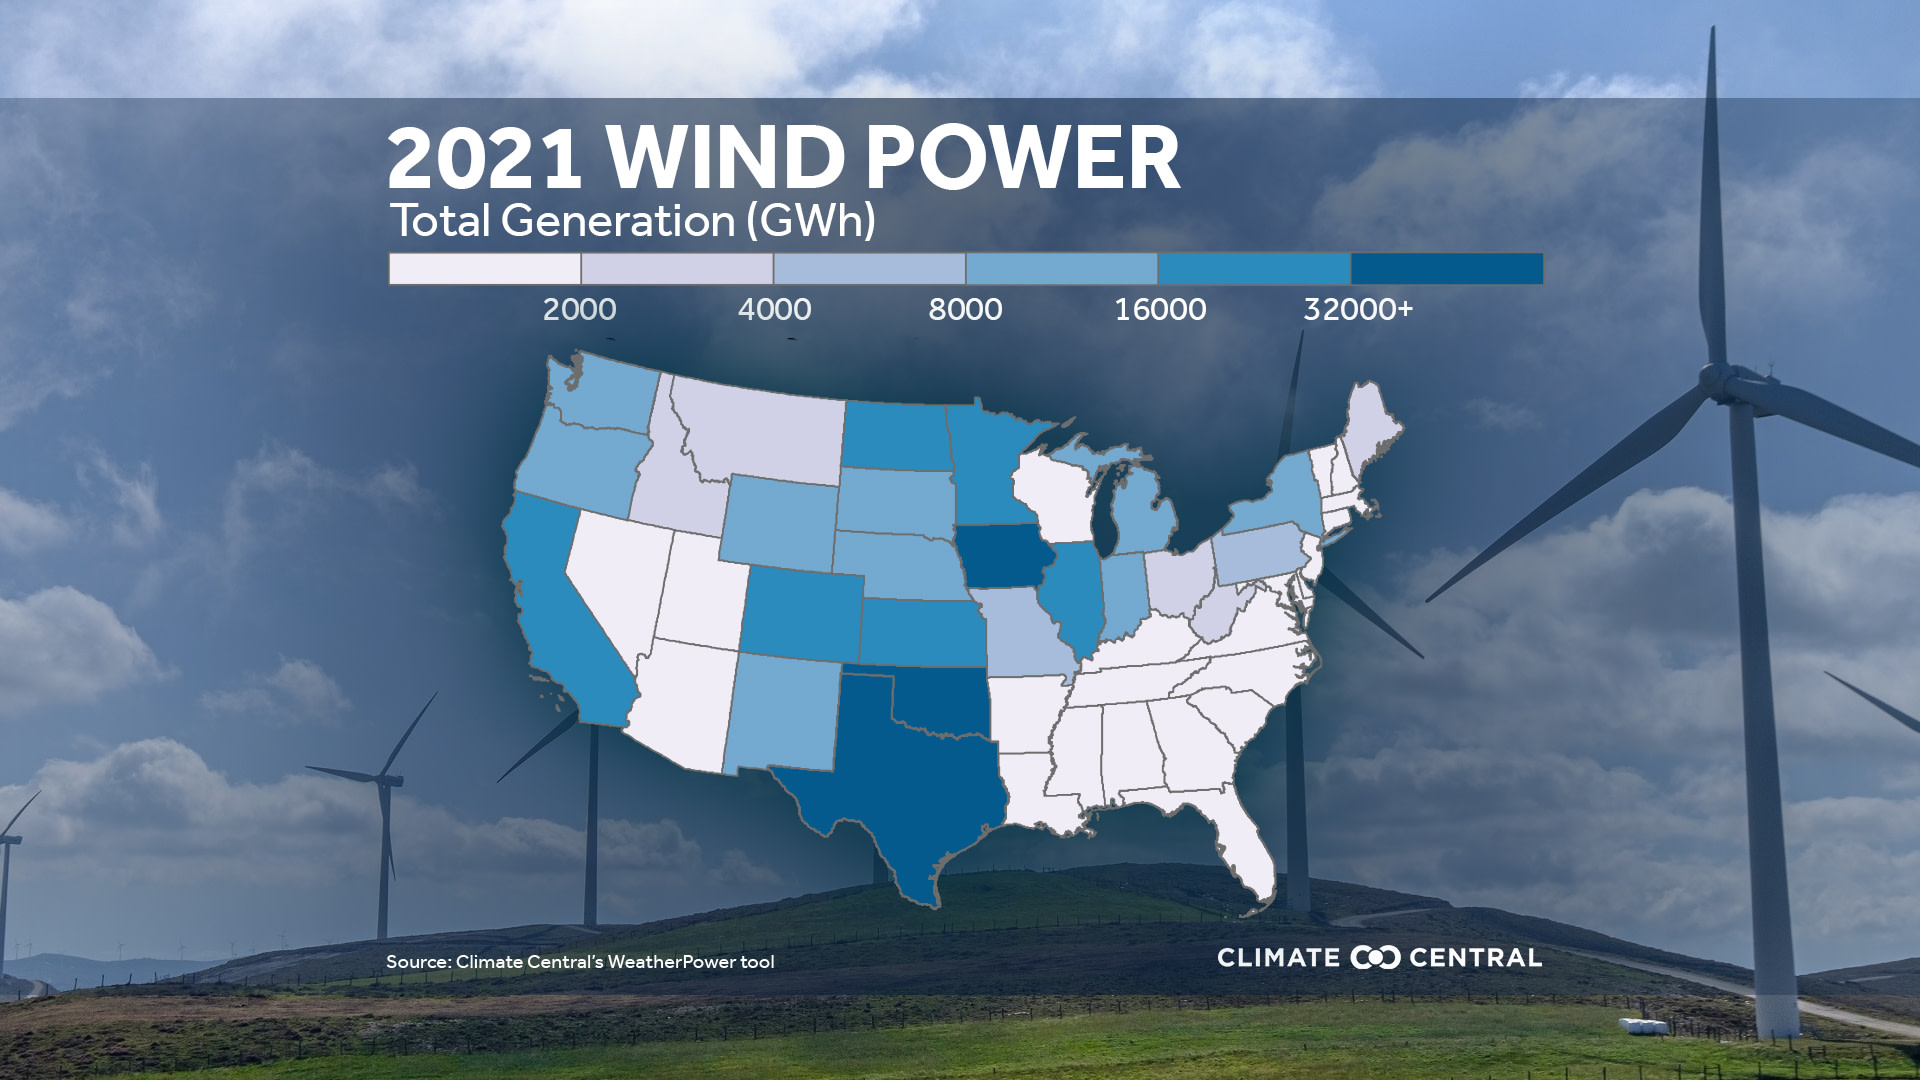
Top wind energy states in 2021
Texas, Iowa, Oklahoma, Kansas, and California generated the most wind energy in 2021. Texas, which generated 113,000 GWh from wind power in 2021 (about a quarter of the country’s total wind energy), produced about three times more than the second-place state (Iowa).
Wind farms require lots of land, so big states like Texas and California have an advantage. Accounting for state size, Iowa, Oklahoma, Texas, Illinois, and Kansas generated the most wind energy per square mile.
The report also breaks down wind energy generation per person, with North Dakota, Wyoming, Iowa, Kansas, and South Dakota leading the way. Of note: Iowa and Kansas ranked within the top five states across all three wind energy generation metrics.
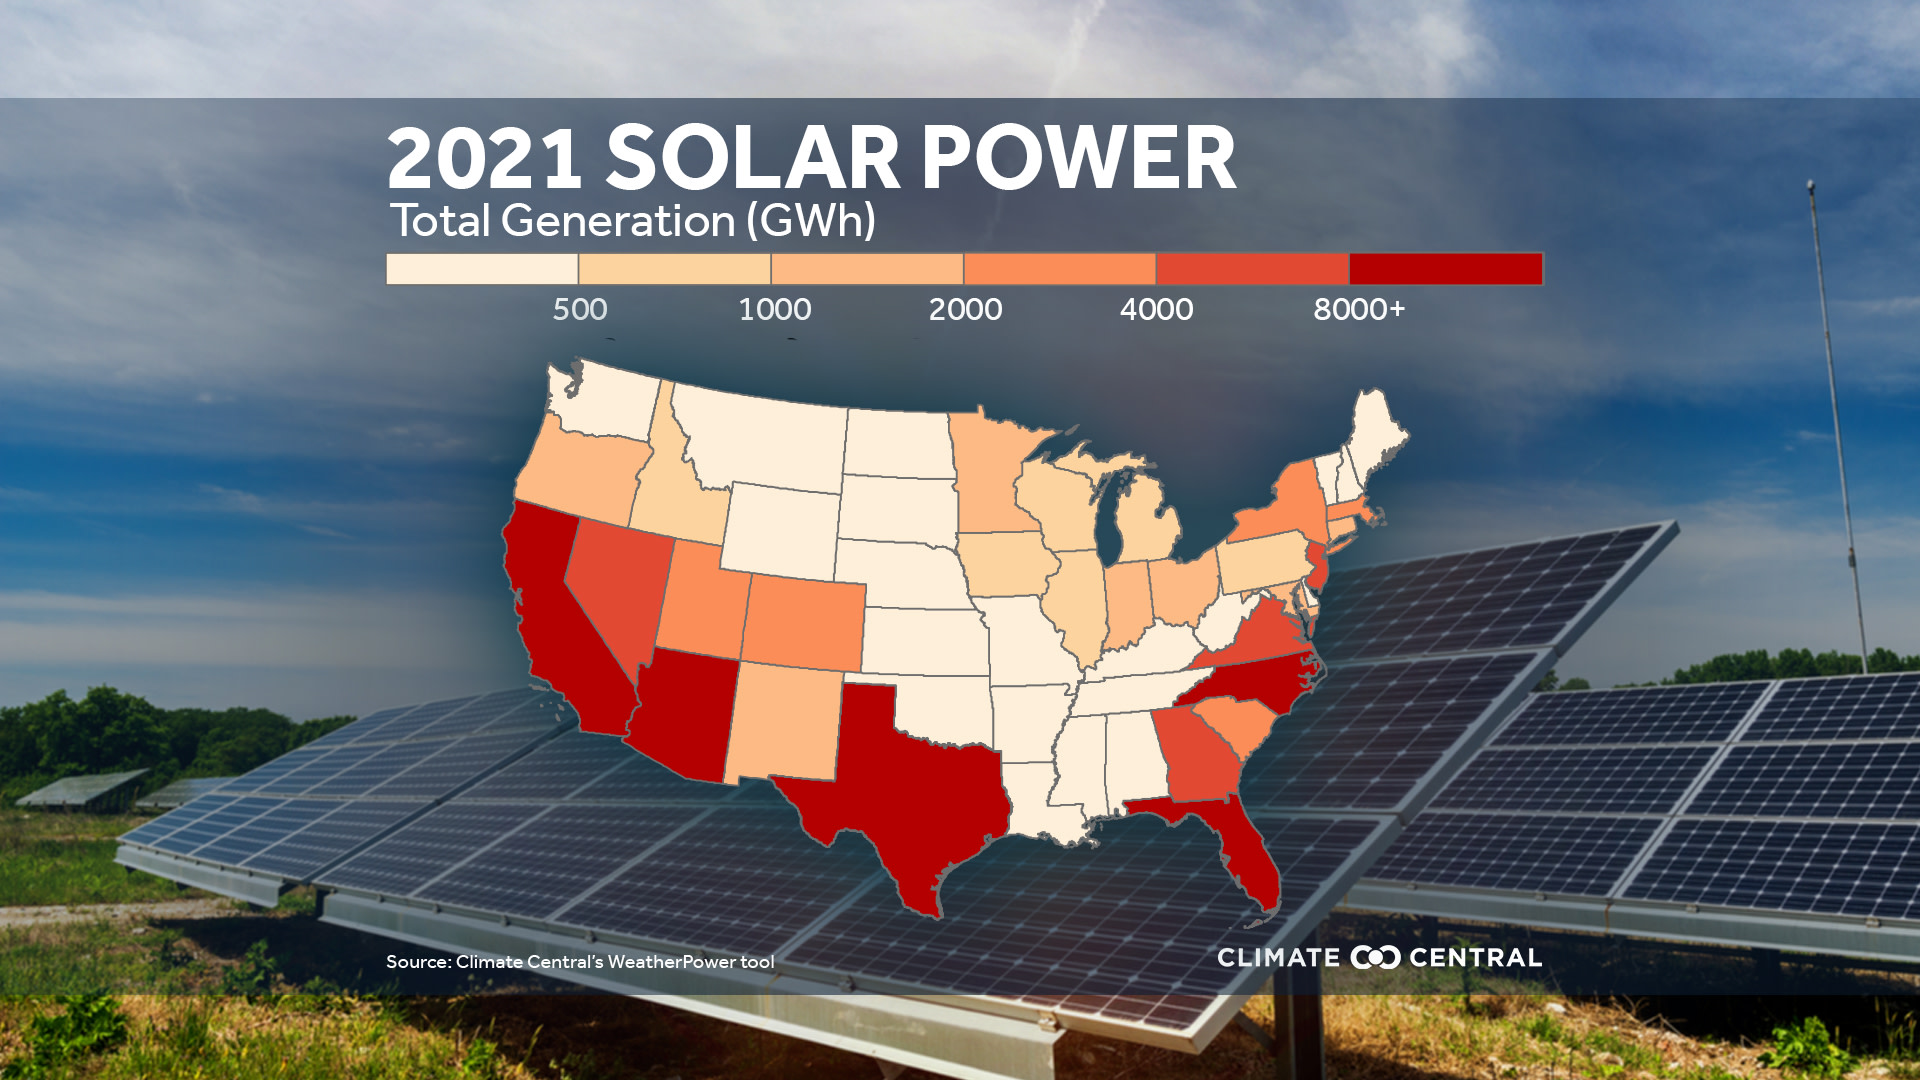
Top solar energy states in 2021
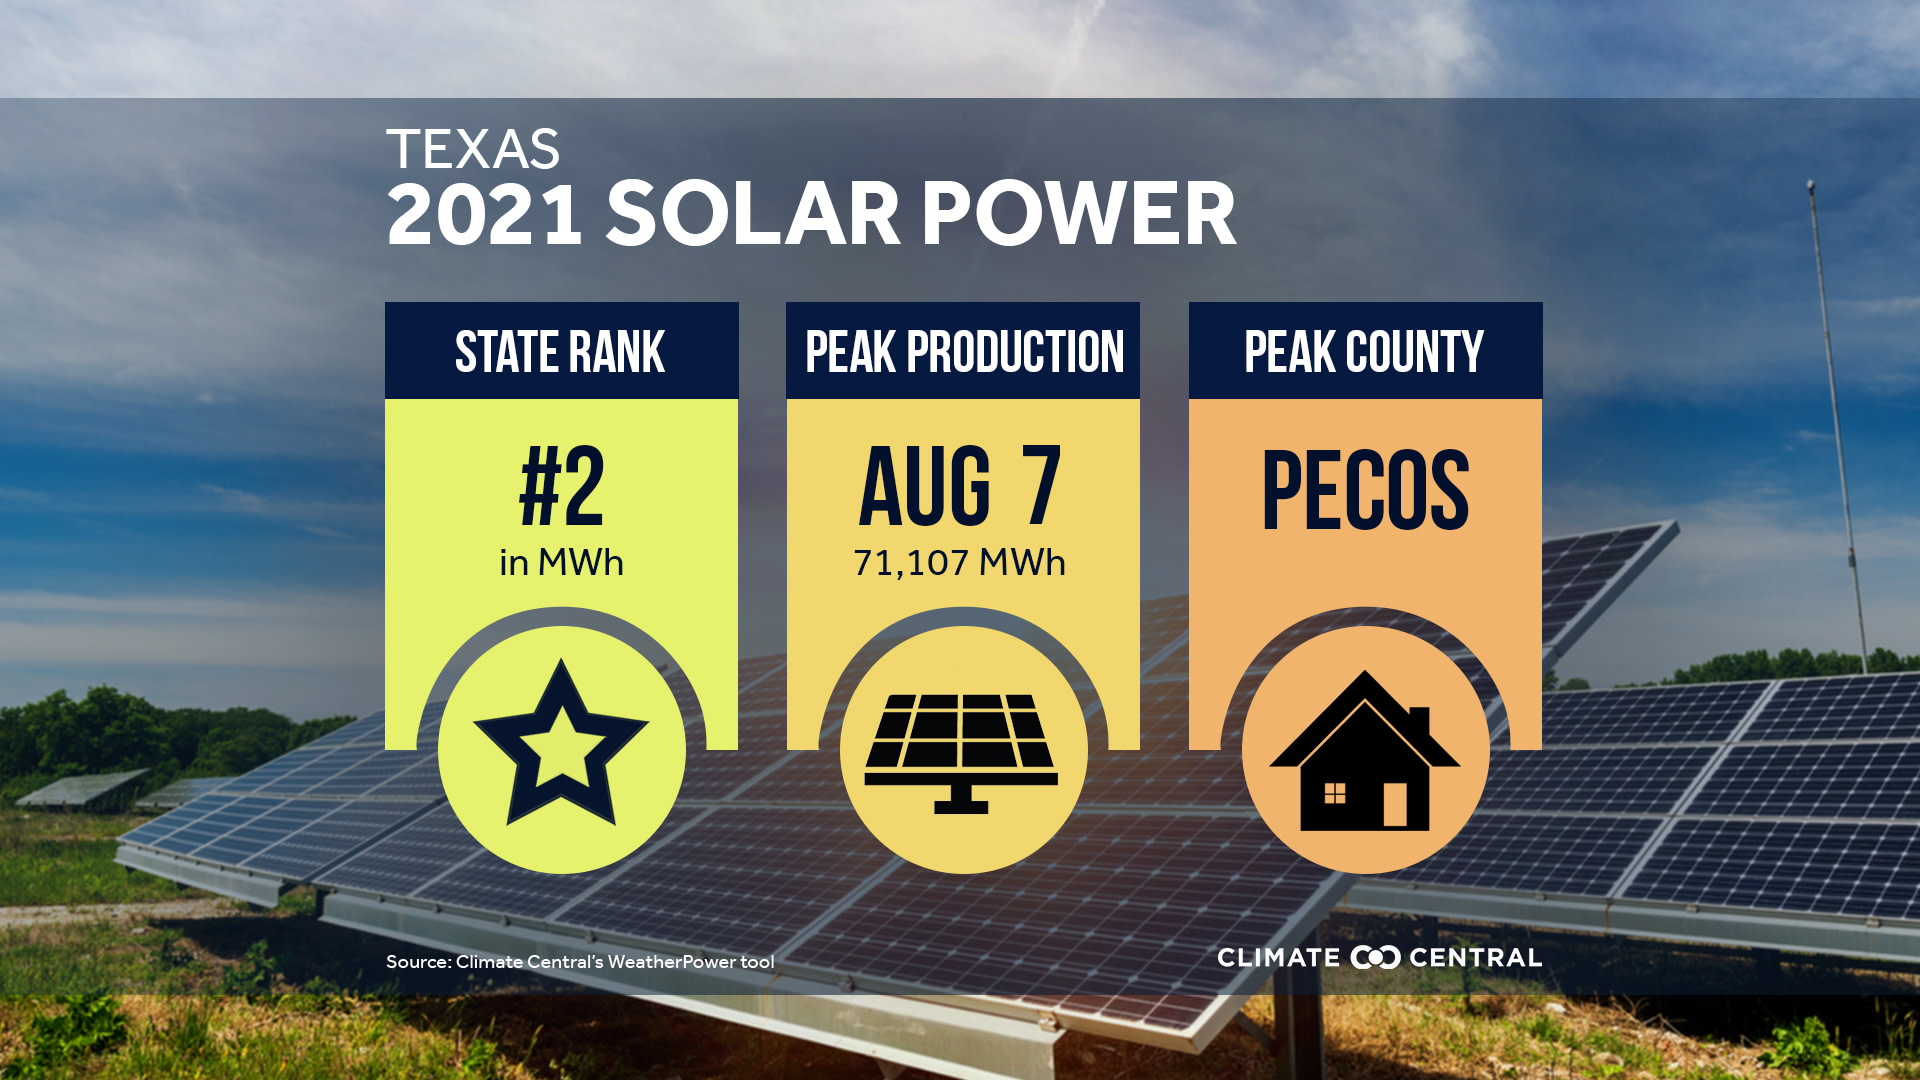
California, Texas, Florida, Arizona, and North Carolinagenerated the most solar energy in 2021. California, which generated an estimated 55,000 MWh of solar power in 2021 (about a third of the country’s total solar energy), produced 3.2 times more solar than the second-place state (Texas).
Solar farms also require lots of land, and Washington, D.C., New Jersey, Massachusetts, California, and Connecticut generated the most solar energy per square mile. Despite its small area, D.C. generated an estimated 2,200 MWh per square mile in 2021—enough electricity to power almost 200 average American homes for a year.
Nevada, Arizona, California, Utah, and North Carolina generated the most solar energy per person. Of note: despite being the most populous state, California still generated the third most solar energy per person in 2021.
Progress toward goals
The Net Zero America Project estimates that, in order to reach net-zero emissions by 2050, in one scenario the U.S. would need to generate 2.2 million GWh of solar and wind energy annually by 2030—about 3.6 times the total amount the U.S. produced in 2021. Wind and solar production would need to increase nearly twice as fast as in recent years to keep U.S. energy goals on track.
Explore the full WeatherPower Year in Reviewreport to learn more and see where your state ranks.
POTENTIAL LOCAL STORY ANGLES
Bringing your audience up to speed on wind and solar power?
Check out Climate Central’s Wind and Solar Power 101 guide, as well as our Solutions Series briefs on solar and wind energy.
Where does your state’s energy come from?
The U.S. Energy Information Administration (EIA)’s U.S. Energy Atlas provides searchable data and interactive maps for all aspects of the nation's energy system. Additional state-level data from the EIA can be found here.
LOCAL EXPERTS
The SciLine service, 500 Women Scientists or the press offices of local universities may be able to connect you with local scientists who have expertise on renewable energy and climate change. The American Association of State Climatologists is a professional scientific organization composed of all state climatologists.
NATIONAL EXPERTS
Eric Larson, Ph.D.
WeatherPower Tool Developer
Senior Research Faculty Member, Energy Systems Analysis Group
Princeton University, Andlinger Center for Energy and the Environment
elarson@princeton.eduJohn Hensley
Vice President, Research & Analytics
American Clean Power
Contact: jhensley@cleanpower.org
Related Expertise: Energy policy and industry market analytics
METHODOLOGY
For the full methodology, readers are referred to the WeatherPower Year in Review report.