Climate Matters•October 14, 2019
WeatherPower 2.0: New Features
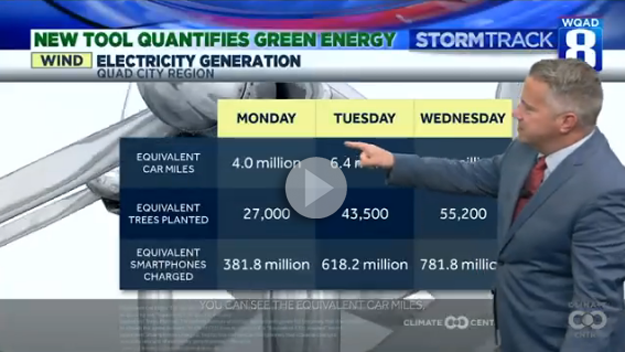
Video featuring Eric Sorensen (Quad Cities - WQAD/ABC) and Amelia Draper (Washington, D.C. - WRC/NBC)
Our updated WeatherPower tool has even more ways to show the power of renewable energy. The tool still forecasts the wind and solar electricity that is already being generated, based on weather predictions and local energy installations. It also provides customizable, production-ready graphics, with options to show cost saved or a Power Index (from 0-10, where 10 indicates perfect sun or wind conditions). Now, there’s more:
New geographies: including graphics by media market, state, county, and congressional district
New metrics: calculating the CO2 emissions avoided by the generation and use of wind and solar electricity—as well as:
The amount of car travel that would emit that much CO2
The number of trees planted that would absorb that much CO2
The number of smartphones that could be charged with the clean electricity
Updated installations: incorporating new wind and solar facilities that continue to come online
Though solar potential dips a bit as the days get shorter, wind speeds typically pick up in the active transitional weather of October. And year-round, wind and solar use is accelerating across the country. Renewables generated a record 17.6% of U.S. electricity in 2018, and are expected to be the fastest growing source of electricity generation in 2019-2020 (according to the U.S. Energy Information Administration). Of the additional energy capacity planned for 2019, nearly two thirds come from renewables.
This rapid growth of renewable energy is both reducing greenhouse gas emissions and creating local jobs. Economy-wide, wind and solar service jobs are projected to be the two fastest-growing occupations in the next decade. Solutions stories like these can capture viewers’ attention for longer and are more likely to be shared, according to testing by the Solutions Journalism Network. They also heighten feelings of optimism, knowledge gained, and involvement in the issue itself (see more in our recent webinar).
WeatherPower is a way to connect with your audiences daily on a topic that they overwhelmingly support. For examples of how to incorporate this material into your weathercast or digital offerings, here are some examples:
Jesse Guinn’s long-form story (Peoria - WEEK/NBC)
Ava Marie’s engagement with Facebook followers (Baltimore - WBAL/NBC)
David Yeomans’s morning solarcast—like a pollen, UV, or boating forecast (Austin - KXAN/NBC)

Amber Sullins — Phoenix (KNXV/ABC)

Ariel Rodrguez — Miami (WSCV/Telemundo)

Sven Sundgaard — Minneapolis (KARE/NBC)

Tammie Souza— Philadelphia (WCAU/NBC)
METHODOLOGY: Our WeatherPower page gives a brief explanation for each metric available. For the full 30-page methodology, click here.