KEY CONCEPTS
While climate change is shifting us toward a hotter climate, summer heat is seeping into our cooler seasons
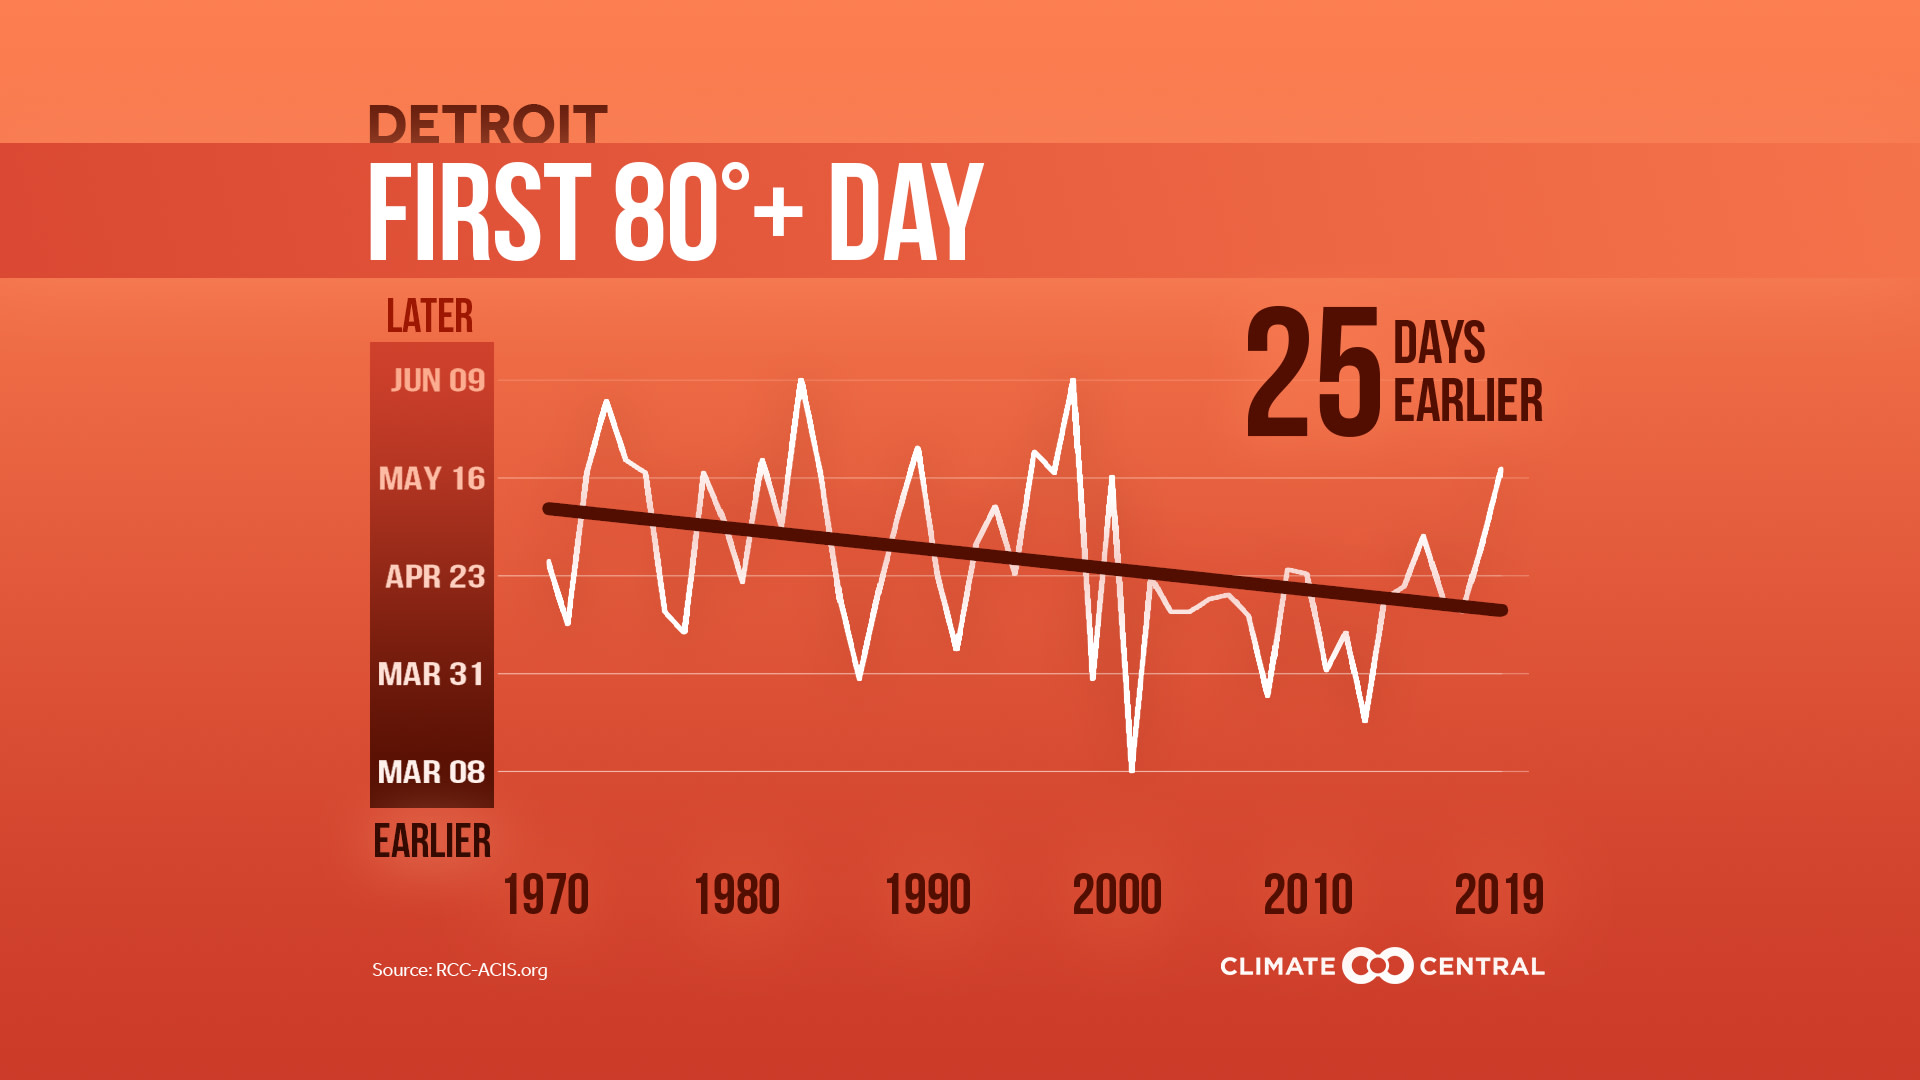
Climate Central found that summer-like heat is arriving considerably earlier in some areas, with 54% of cities analyzed recording summer temperatures at least a week earlier, on average, than they did fifty years ago
Summer heat presents a significant challenge to public healthーespecially with many cooling centers either closed or being reimagined due to the current pandemic
Spring is a transitional season with both warm and cold days, even in a warming climate. But long-term trends show that the arrival of summer-like temperatures is starting sooner across much of the U.S. These changes are beginning to warp the seasons as we know themーsqueezing out the winter chill and stretching the summer heat long before us.
To investigate the onset of summer heat, Climate Central analyzed the first calendar day when local temperatures reach their average daily summer high, and how that first day may have changed since 1970. We found that 54% of cities recorded summer temperatures at least a week earlier, on average, than they did fifty years ago. The top 15 stations with the largest advances in the onset of summer temperatures all recorded summer heat arriving more than three weeks earlier.
With the current pandemic, we’re bracing ourselves for a summer quite unlike any other. There is continued uncertainty around public gathering areas across much of the countryーincluding not only pools, beaches and summer camps, but also cooling centers like the local libraries and malls which many rely on to stay safe during the hot months. Finding new ways to adapt to the challenges of this summer’s heat should remind us of the abundance of longer-term climate solutions at handーfrom introducing green infrastructure to switching to renewable energy sources for cooling.
POTENTIAL LOCAL STORY ANGLES
How are local government and communities preparing for this summer’s heat?
The COVID-19 pandemic will present novel challenges to preparing for extreme heat this summer. The Center for Climate, Health and the Global Environment at Harvard has resources dedicated to informing public officials and media about planning for heat during the COVID-19 pandemic. Find out about your state’s plans for tackling the heat by contacting your local Emergency Management Agencies.
Everything you need to know about Urban Heat Islands
Many cities are already taking climate adaptation steps in order to reduce the heat island effect. Learn more about cooling strategies for urban heat islands and find out what steps your locality is taking to adapt. You can also compare heat island severity across the U.S.
How is heat affecting public health?
Extreme heat is the deadliest kind of hazardous weather. The Center for Disease Control (CDC) tracks health and heat data through its public health tracking network for 25 states and New York City. Summer heat and sun can also cause air stagnation and accumulation of ground-level ozone. Find out more about climate change and air quality from the American Lung Association, and check out their rankings of cleanest cities.
EXPERTS TO INTERVIEW
Radley Horton, Ph.D
Lamont Associate Research Professor
Columbia University Earth Institute
rh142@columbia.edu
Research interests include climate change and extreme weather, including impacts and resilience relating to extreme heat and heat with high humidity.
Mona Sarfaty, MD MPH FAAFP
Executive Director
Medical Society Consortium on Climate and Health
George Mason University Center for Climate Change Communication
msarfaty@gmu.edu
Dr. Aaron Bernstein
Interim Director
Center for Climate, Health and the Global Environment at Harvard T.H. Chan School of Public Health
Pediatrician at Boston Children’s Hospital
Contact: Anna Miller, amiller@hsph.harvard.edu
Rob Dale
Meteorologist and Emergency Planner,
Ingham County (MI) Office of Homeland Security & Emergency Management,
International Association of Emergency Managers - Climate and Weather Caucus
rdale@ingham.org
METHODOLOGY
Daily temperature data from 1970-2019 were obtained from the Applied Climate Information System. Thresholds were calculated by finding the average summer maximum temperature from 1970-2019 and rounding that number to the nearest five degrees. For example, the average summer maximum temperature (1970-2019) in Abilene is 93.4°F so the appropriate threshold would be 95°F. Only 242 of our 244 stations are included in summary statements due to large data gaps in St. Johnsbury, Vt. and Wheeling, W. Va.
