Climate Matters•September 1, 2021
Summer 2021 Review

KEY CONCEPTS
Summer 2021 was definitely a “Summer of the Extremes” as floods, fires, drought, intense heat, and powerful storms ripped across the U.S. and the globe.
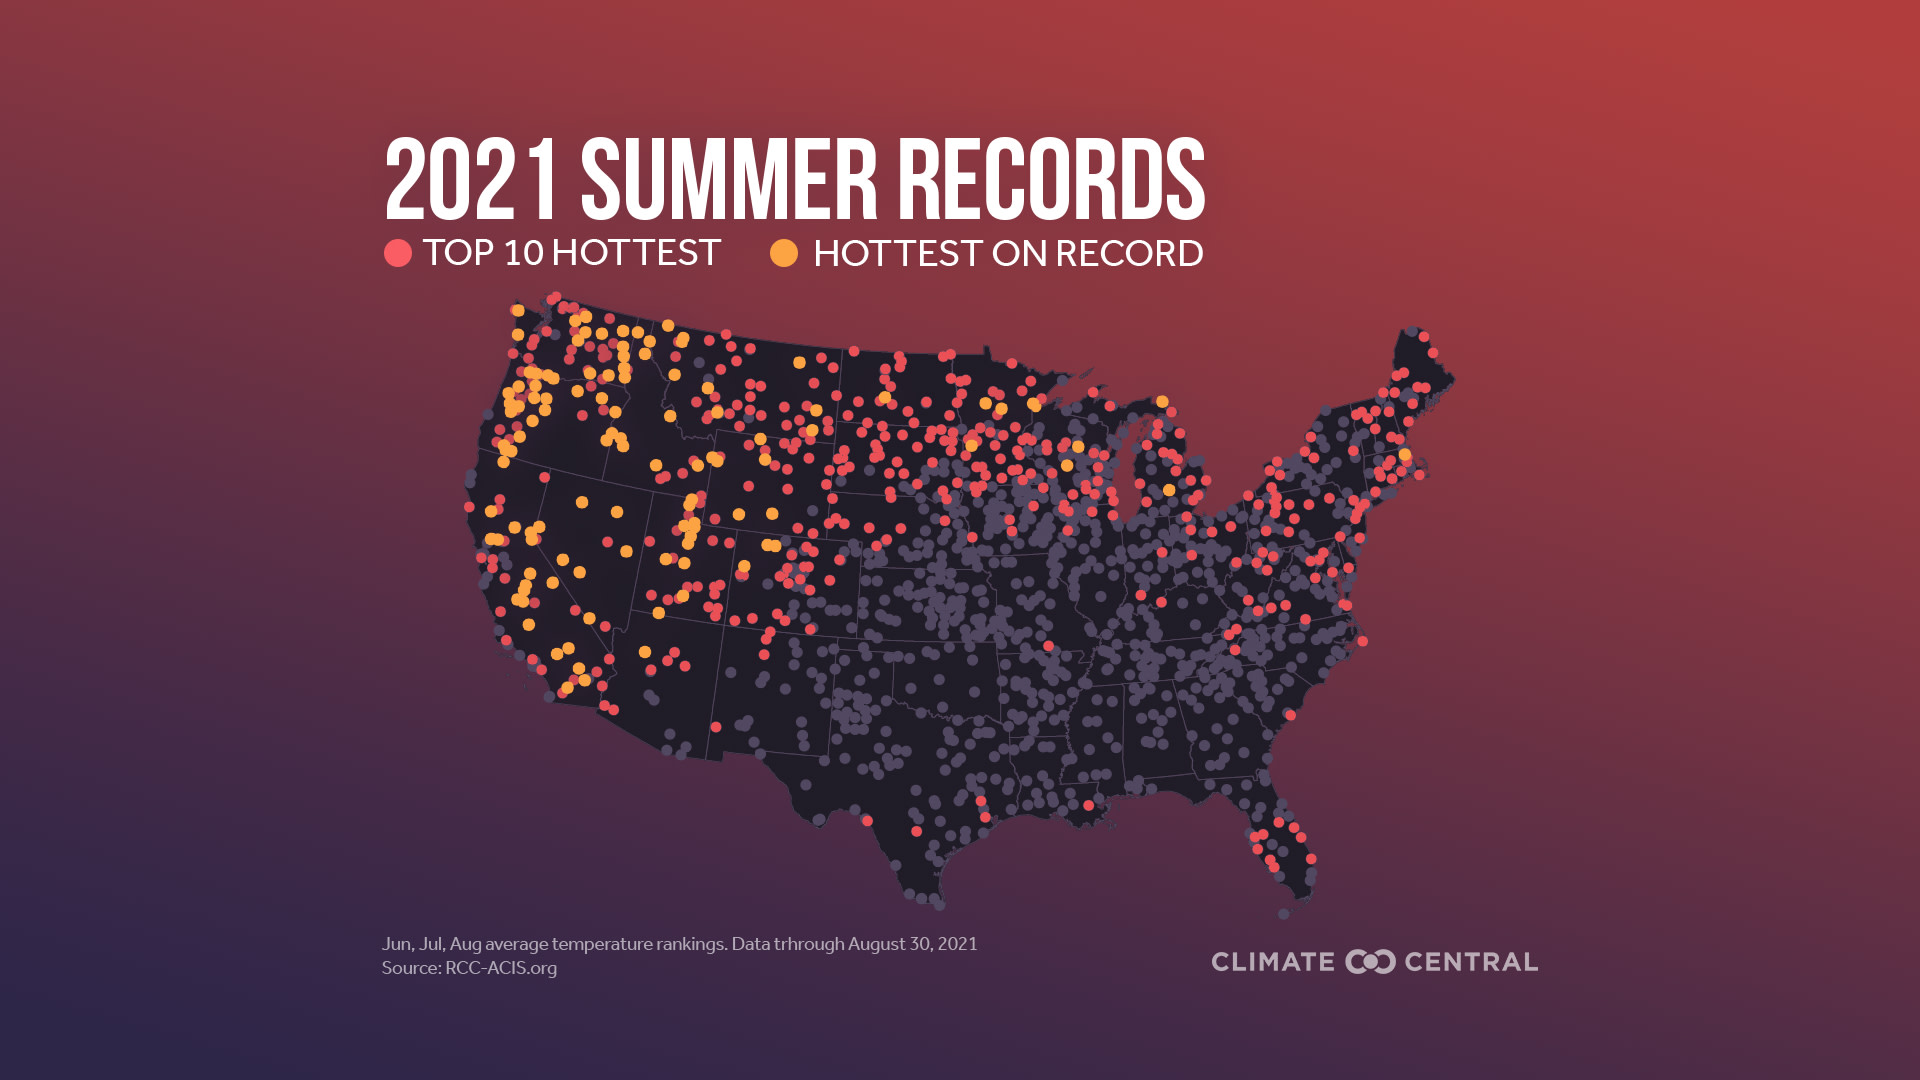
Record or near-record heat baked the U.S. this summer, especially the Pacific Northwest. Climate Central conducted its own analysis on local heat records and found that 38% (538) of 1396 locations had one of their 10 hottest summers this year.
Heat wasn’t the only extreme weather event this summer. Across the nation, many regions were hit with persistent drought, heavy flooding, strong storms, or burning wildfires. The more we emit greenhouse gases into the atmosphere, the more extreme weather events we will face in the future.
Summer 2021 was definitely a “Summer of the Extremes” as floods, fires, drought, intense heat, and powerful storms ripped across the U.S. and the globe. Our warming climate is causing more extreme weather to happen, and this trend will continue if we keep emitting greenhouse gases. In this release, Climate Central recaps on some of the extreme weather of this past summer.
Record Heat: Record Heat: Intense and record-breaking heat is a direct result of climate change. By pumping heat trapping greenhouse gases into the atmosphere, we are raising temperatures at the Earth’s surface. In a stable climate, we would expect record highs and lows to be relatively balanced over long time periods. But in a warming climate, we are seeing more record highs being broken—especially this summer:
On June 27th and 28th, the Pacific Northwest had a heatwave that shattered all-time record highs by large margins (e.g. Quillayute, Washington broke their record by 11°F). More than 200 people died as a result of the heat, and thousands visited emergency rooms with heat-related illnesses.
A closer look at the heat records: Climate Central conducted its own analysis on local heat records for this summer and over the past couple decades:
Summer 2021 was within the top 10 hottest summers for 38% (538) of 1396 cities analyzed, and 114 cities across the U.S had their hottest summer on record.
From January through August 2021, in an analysis of our 246 Climate Central stations, 58% (142) had more record temperature highs than lows, and 62% of those cities (88 of 142) only broke record highs.
Summer 2021 was not only about the heat...
Flood & Drought: In a warming climate, the atmosphere can hold more moisture—supercharging the water cycle. This leads to more intense evaporation (drought) in some areas and heavier precipitation (flooding) in others. This summer the West has had persistent, severe drought conditions while some areas east of the Mississippi were overwhelmed with flooding.
As of August 25th, 94% of the West is in some sort of drought, according to the U.S. Drought Monitor, and 40 million people in California and Nevada are under drought conditions.
This summer, Lake Mead, the country’s largest reservoir, is at its lowest water level since it was filled in the 1930s. Lake Oroville has also reached critical water levels, forcing its hydroelectric plant to shut down for the first time.
Detroit had significant water damage to school, homes, and businesses after a heavy rainfall flooded the metro area in June. In August, up to 17 inches of rain caused major flash flooding and damage in Tennessee, resulting in at least 20 deaths.
Flood events are also happening across the globe. In Germany and Nigeria, heavy, persistent rainfall caused catastrophic flooding that resulted in property damage, injuries and fatalities.
Wildfires: Climate change increases the risk of larger, more intense wildfires. Fire weather—defined by warmer temperatures, drier conditions, and wind—allows fires to spread faster and farther, leaving devastation in their wake. Large fires across the West began in July, straining fire-fighting resources earlier this summer. In August, there are 11 states reporting large fires:
As of August 27th, there are 88 large fires burning around 2.4 million acres of land. Major fires include the Caldor and Dixie fires.
Wildfires have resulted in extremely dangerous air quality across the West and even as far as the East Coast. Some localities near the Caldor fire in California had an Air Quality Index (AQI) beyond the 500 “hazardous” scale (reaching around 1000).
Hurricanes and Storms: The combination of warmer air and water supercharges the water cycle, allowing hurricanes and tropical storms to become stronger and cause damage. The Atlantic hurricane season has been active this summer, with several landfalls already. Last week, Hurricane Ida hit the Louisiana coast as a Category 4 storm with 150 mph winds. Hurricane Ida is one of the three strongest hurricanes on record to hit Louisiana (using surface pressure).
Tropical Storms Claudette, Danny, Fred, and Henri, along with Hurricane Elsa, brought flooding, power outages, and other damage to areas to the U.S. coasts.
Click here for more hurricane reporting resources from our 2021 Hurricane Season Preview.
POTENTIAL LOCAL STORY ANGLES
How is excessive heat affecting local health?
Widespread heat, amplified by climate change, is an increasing risk to human health. Check out the 2018 National Climate Assessment report that highlights exactly how heat impacts human health. Furthermore, the Center for Disease Control (CDC) released several detailed infographics on how to protect yourself from the heat.
Tools for reporting on extreme weather events and disasters near you:
A number of journalism schools and organizations provide advice for responsibly reporting on disasters, including focusing on safety, data, and cultural sensitivity. You can find preparedness materials for hurricanes, flooding, and other health emergencies at the Centers for Disease Control and Prevention (CDC). In addition, you can uncover more information about extreme weather events through SciLine’s multiple fact sheets.
What is climate change emergency management and what does it look like in your state?
Emergency management can help reduce risk in vulnerable communities against the impacts of climate change. FEMA has a dedicated page with tools, data, and resources to learn more. For state specific emergency management information, search your state here on the USA.gov site.
LOCAL EXPERTS
The SciLine service, 500 Women Scientists or the press offices of local universities may be able to connect you with local scientists who have expertise on climate change. The American Association of State Climatologists is a professional scientific organization composed of all 50 state climatologists.
NATIONAL EXPERTS
Daniel Swain, Ph.D., Climate Scientist
Institute of the Environment and Sustainability
University of California Los Angeles
Contact: dlswain@ucla.edu
Power outage/grid expert:
Roshi Nateghi, Ph.D. Assistant Professor of Industrial Engineering
Purdue University
Contact: rnateghi@purdue.edu
METHODOLOGY
Series of daily records were identified each year since the start of the period of record, then aggregated by decade. To be clear, this not only represents the location’s current record for each calendar day, but a count of the records as they happened since that station thread was established. This series is based on Threadex data, when available, so it represents each of the local historic records as accounted by NOAA/NCEI; records over time may exist for different siting locations, corresponding with the NOAA supported records.
For the national records map, average summer (June, July, and August) temperatures were calculated using data from the Applied Climate Information System and ranked for more than 1,390 stations with at least 51 years of data. Data was collected on Aug 30th.
The stories below are served through a new pilot program from our partners at the Solutions Journalism Network, and were not created by or with Climate Central.