Climate Matters•September 16, 2020
Summer 2020: One for the Record Books
KEY CONCEPTS
Record heat waves, raging wildfires, and an active hurricane season, all intensified by human-induced climate change, dominated this summer’s headlines even in the midst of a chaotic news cycle. However, the excessive heat made summer 2020 one for the record books as the fourth-hottest summer in the contiguous U.S..
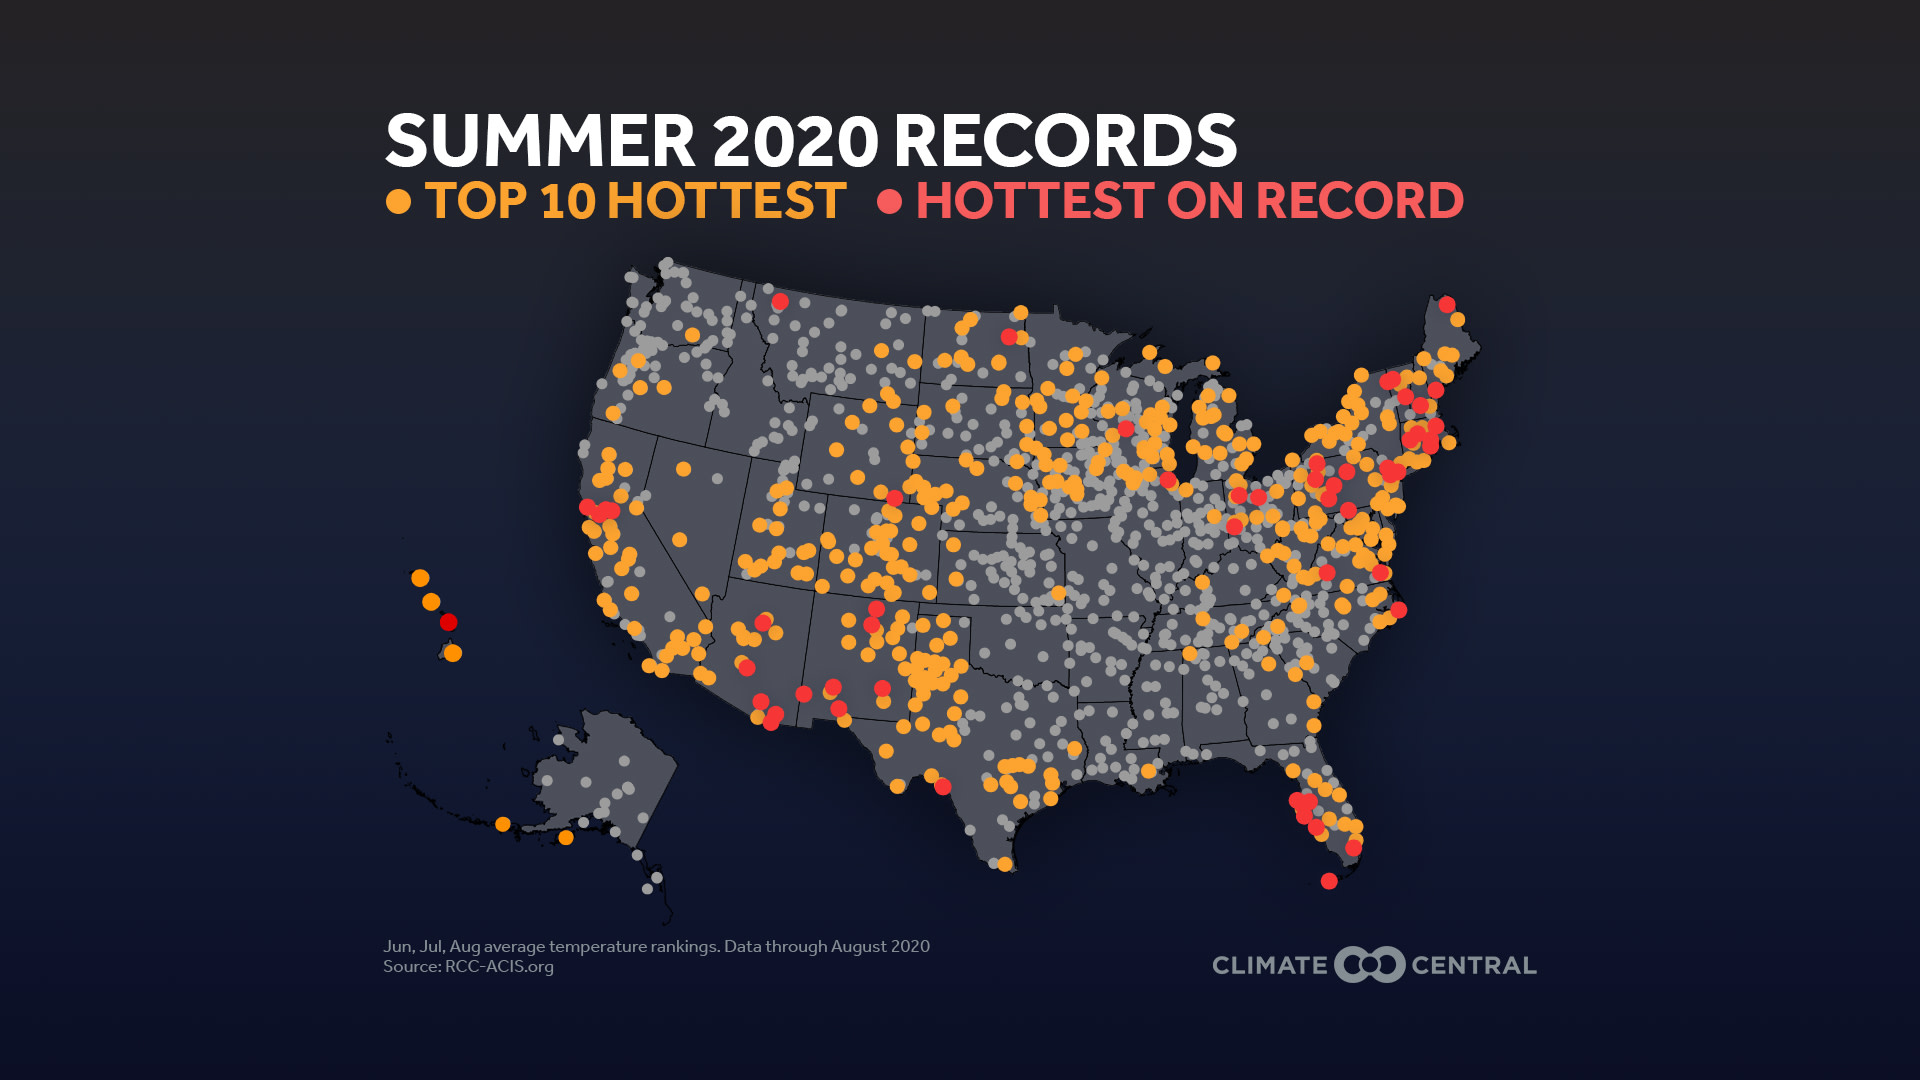
Summer 2020 was within the top 10 hottest summers for 37% (452) of 1203 cities analyzed, and 55 cities across the U.S had their hottest summer on record. Furthermore, from January to August 2020, local record highs outpaced record lows in most places—a hallmark of climate change as global temperatures increase.
Excessive heat is the leading weather-related killer in the U.S., and disproportionately threatens vulnerable populations, particularly black and immigrant communities in urban areas where there is low tree coverage. To reduce heat risk in these neighborhoods, city planners are implementing cooling solutions, like planting trees, designing green roofs, and creating more accessible cooling stations.
This summer, extreme weather events dominated headlines across the U.S.: Death Valley, Calif. reached a record-breaking 130℉, parts of Louisiana and Texas were rocked by Hurricane Laura’s 150 mph winds, and California burned as its 1st, 3rd, and 4th largest wildfires on record raged over the dry landscape. All of these events have a common contributing factor: climate change. Human activities are polluting the atmosphere with heat-trapping gases and causing global temperatures to rise. As a result, hurricanes and wildfires are becoming more intense and excessive heat more common.
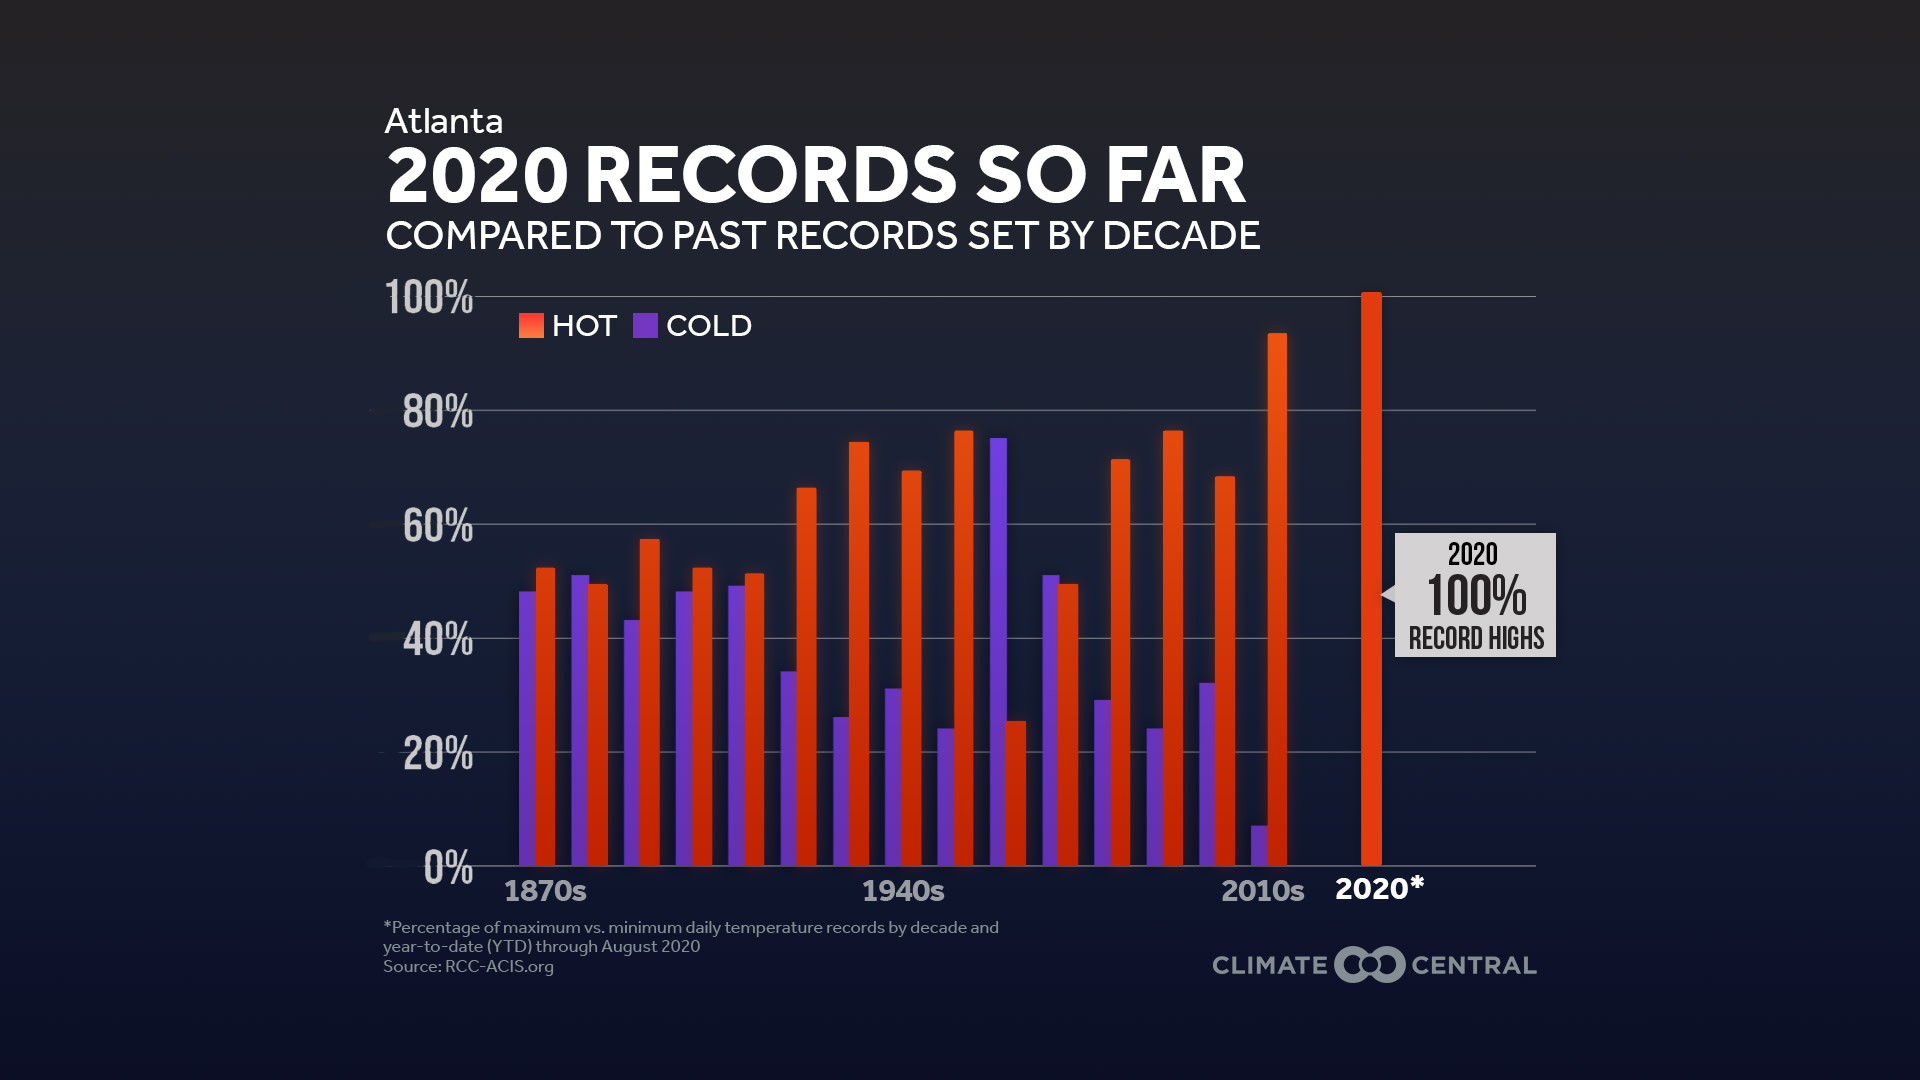
Summer 2020’s heat is one for the record books. It was the fourth-hottest summer on record for the contiguous U.S. and third-hottest June-August period globally. Many cities in the Southwest, Southeast, Mid-Atlantic, and Northeast either broke or tied their records for their hottest summer to date. Investigating this further, Climate Central uncovered that summer 2020 was within the top 10 hottest summers for 37% (452) of 1,203 cities analyzed, and 55 cities had their hottest summer on record. Moreover, these increases in local record highs reflect a longer-term trend. From January through August 2020, in a separate analysis of 231 cities, 73% (170) had more record temperature highs than lows, and 50% of those cities (86 of 170) only broke record highs. A notable example is Miami, Fla. that experienced 22 daily record highs and 0 lows. This imbalance of record highs to lows is a hallmark of climate change as the global average temperature increases.
Excessive heat is the leading weather-related killer in the U.S. This is true especially for populations that are older, have pre-existing health conditions, work outside, or have no access to air conditioning. Furthermore, heat risk is high in urban areas because of the abundance of dark, heat-absorbing surfaces. Heat is also disproportionate within urban areas, particularly in ‘redlined’ Black and immigrant communities which tend to have lower tree coverage than whiter neighborhoods.
In many cities, researchers and city planners are working together to mitigate the urban heat island effect. Ongoing mapping projects identify hotspots where heat adaptation solutions are most needed. Increasing shade coverage with trees, designing green or cool roofs to replace darker, hotter surfaces, and assigning more cooling centers in vulnerable communities are all effective strategies. However, reducing greenhouse emissions is the best way to mitigate excessive heat and reduce the risk of intense hurricane and wildfire seasons in the future.
POTENTIAL LOCAL STORY ANGLES
How is excessive heat affecting local health?
Widespread heat, amplified by climate change, is an increasing risk to human health. Check out the 2018 IPCC report that highlights exactly how heat impacts human health. Furthermore, the Center for Disease Control (CDC) released several detailed infographics on how to protect yourself from the heat.
Which neighborhoods in your area are more susceptible to excessive heat?
Check out the Future Heat and Vulnerability Map created by the National Integrated Heat Health Information System (NIHHIS) that assigns a vulnerability score to each county across the U.S. based on race, income, and other parameters.
What actions can be taken in your area to mitigate the impacts of extreme heat?
Researchers and city planners alike are creating effective strategies to lower heat risk in urban areas. The Environmental Protection Agency (EPA) keeps a detailed database of heat-reducing community initiatives searchable by state, strategy, or initiative.
LOCAL EXPERTS
The SciLine service, 500 Women Scientists, or the press offices of local universities may be able to connect you with local scientists who have expertise on excessive heat in your area. The Medical Consortium on Climate and Health has a list of health professional groups across the country interested in human health and climate change. For more information on sports and extreme heat, the Korey Stringer Institute has a list of experts available. In addition, the American Association of State Climatologists is a professional scientific organization composed of all 50 state climatologists.
NATIONAL EXPERTS
Nancy Selover, Ph.D., Arizona State Climatologist, State Climate Office
Research interests: urban heat islands, extreme weather
selover@asu.edu
Jennifer Vanos, Ph.D., Assistant Professor, School of Sustainability, Arizona State University
Research interests: human biometeorology, extreme heat, climate change, public health
jenni.vanos@asu.edu
Vivek Shandas, Ph.D., Professor, Nohad A. Toulan School of Urban Studies and Planning, Portland State University
Research interests: urban planning, urban heat, green infrastructure, community science, spatial analysis, and air quality
vshandas@pdx.edu
Brian Stone Jr., Ph.D., Professor, School of City & Regional Planning; Director, Urban Climate Lab, Georgia Institute of Technology
Research Interests: heat adaptation planning, urban planning, heat mortality risk assessment
brian.stone@design.gatech.edu
METHODOLOGY
Series of daily records were identified each year since the start of the period of record, then aggregated by decade. To be clear, this not only represents the location’s current record for each calendar day, but a count of the records as they happened since that station thread was established. This series is based on Threadex data, when available, so it represents each of the local historic records as accounted by NOAA/NCEI; records over time may exist for different siting locations, corresponding with the NOAA supported records.
For the national records map, average summer (June, July, and August) temperatures were calculated using data from the Applied Climate Information System and ranked for more than 1,200 stations with at least 50 years of data.