Climate Matters•March 4, 2020
Spring Coming Earlier (2020)
KEY CONCEPTS
Our warming climate is causing spring to arrive earlier across much of the U.S. Our analysis finds that spring ‘leaf out’ is happening earlier in 76% (181) of the 239 cities analyzed, compared to 1981. The most dramatic changes are in Flagstaff, Ariz. (18 days earlier), followed by Colorado Springs, Colo. (17 days) and Reno, Nev. (17 days).
Earlier springs create a mismatching in availability of food (and other resources) with important natural events such as migration, hibernation and reproduction.
It might seem appealing to shake off the winter cold sooner, but earlier springs can have negative consequences such as longer allergy seasons, more persistent pests (like mosquitoes), and risks to fruit production.
Download Files for Google Earth (KML)
READY-TO-USE GRAPHICS
Whether you follow the astronomical or meteorological definition, we look to our calendar to tell us the season. By contrast, changes that we see in nature and associate with spring—daffodils emerging, birds chirping—come about through environmental cues such as warmer temperatures, more sunlight and snowmelt.
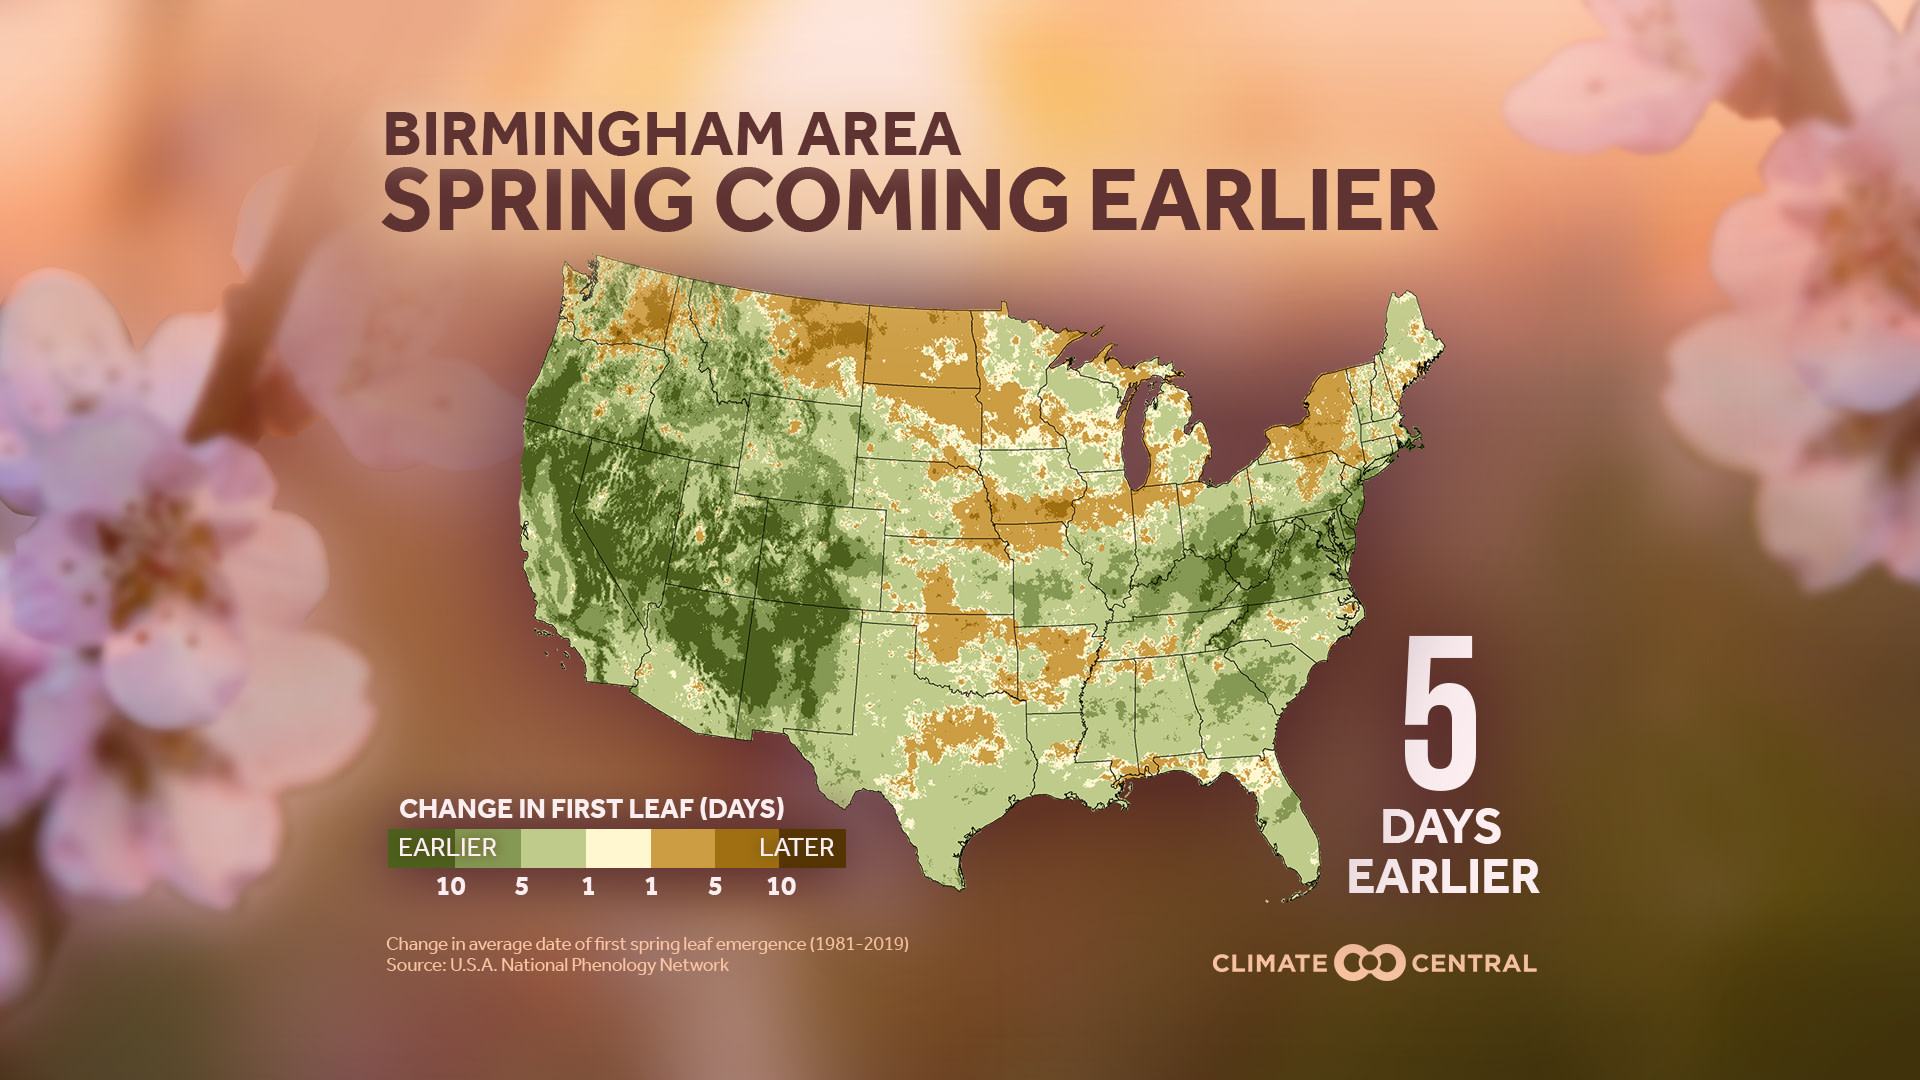
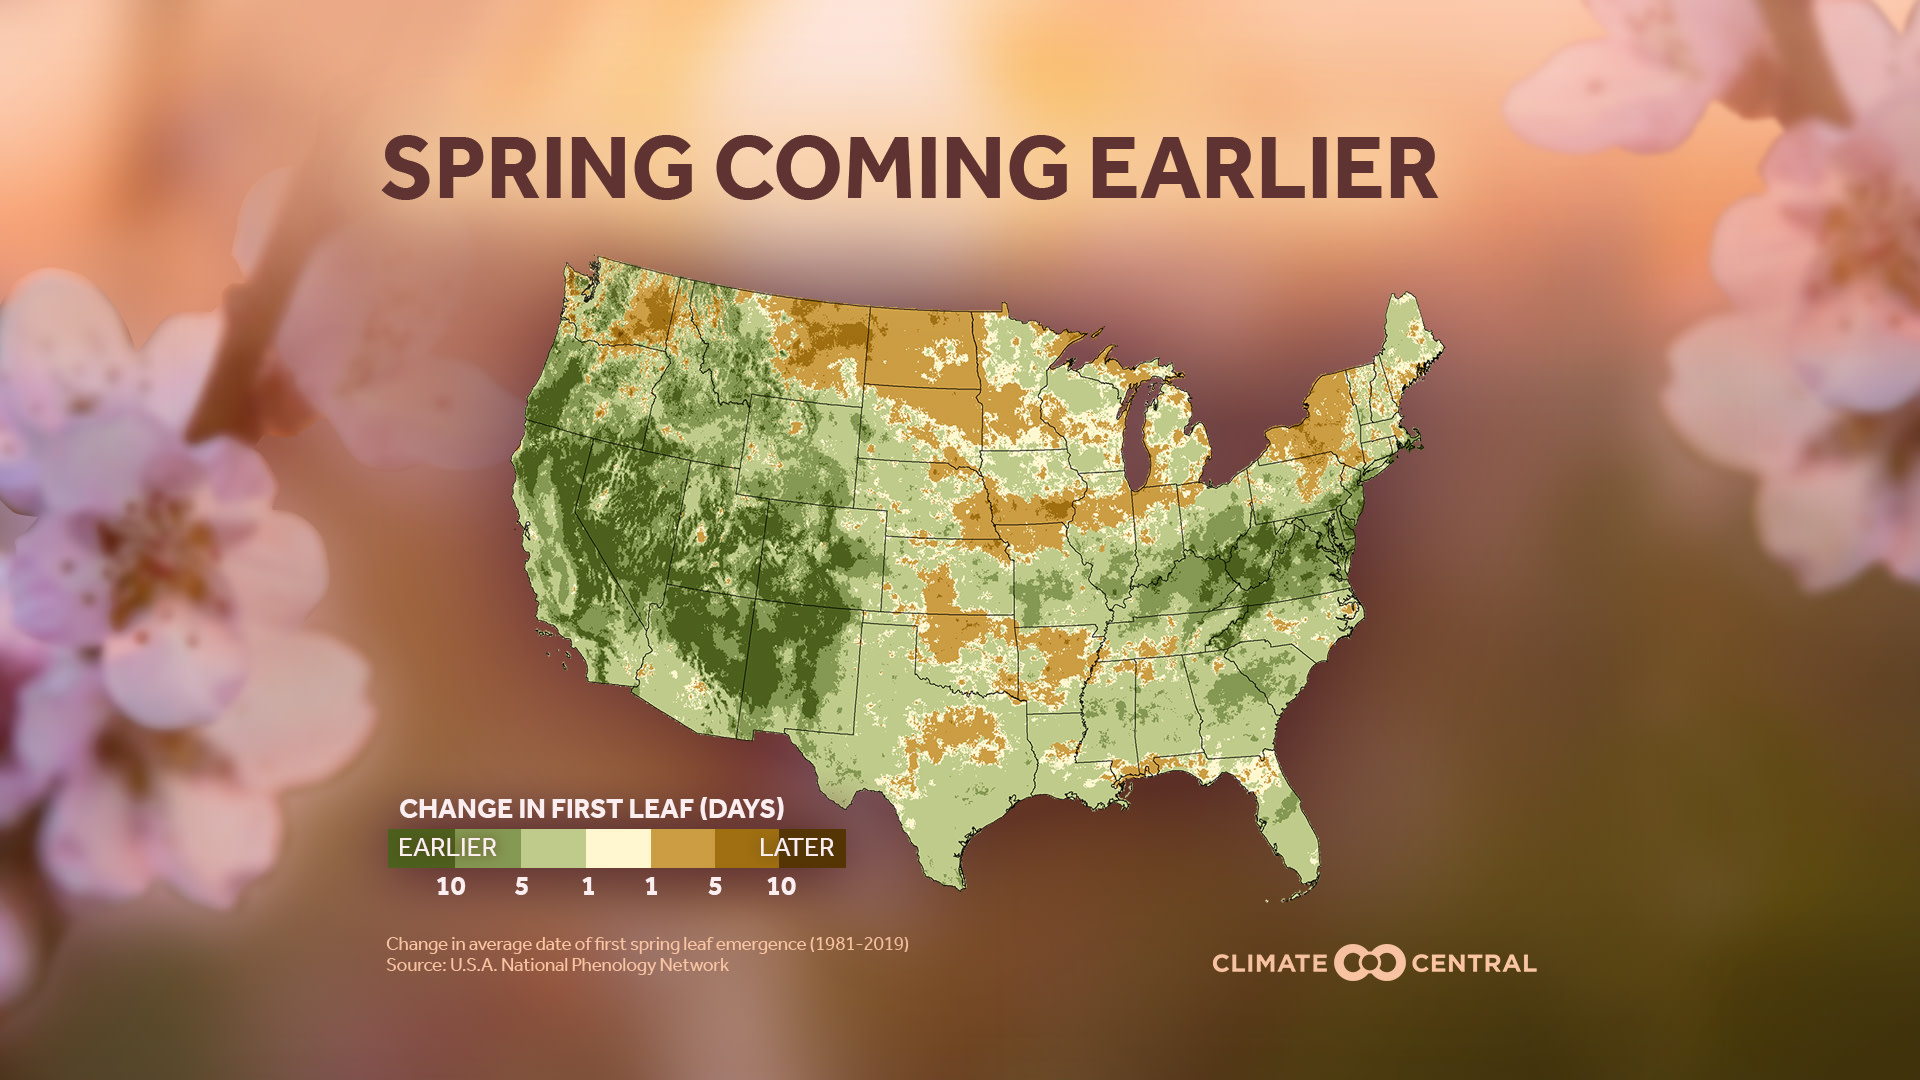
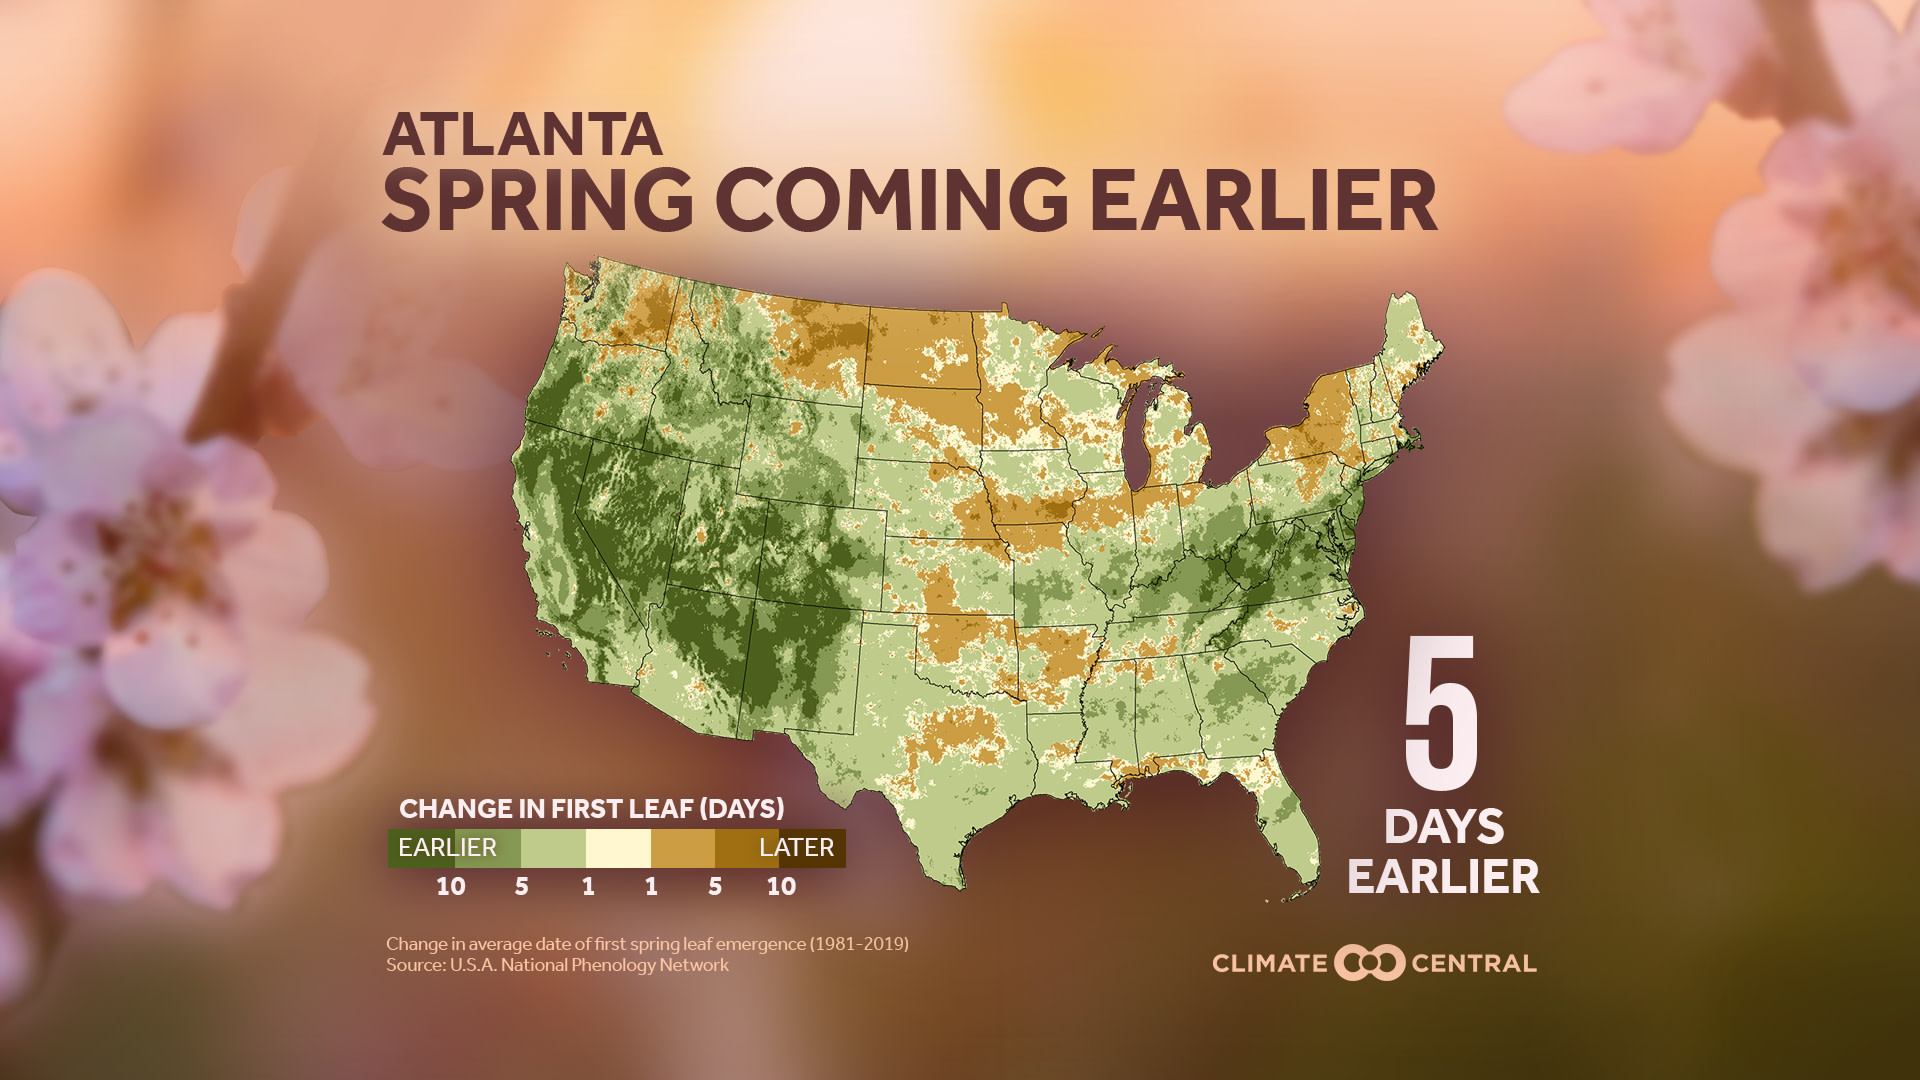
Last week we looked at how spring trends have been changing due to climate change—with many areas experiencing increasing average temperatures, more spring days above normal, and earlier dates of last freeze. This week we explore the impact of these changes on the natural world. We find that the timing of natural phenomena, also known as phenology, has shifted. As a result, spring is coming earlier across much of the United States.
‘Leaf out’ is a common marker that scientists use to keep track of spring phenology—it’s the time that leaves emerge on early spring plants (namely, honeysuckle and lilac). According to our analysis, 76% (181) of the 239 cities analyzed are seeing their average annual first leaf come earlier since 1981. Flagstaff, Ariz. registered the most dramatic change, with the first leaf coming 18 days earlier, followed by Colorado Springs, Colo. (17 days) and Reno, Nev. (17 days).
Earlier springs can cause a mismatch in the availability of food and other resources for animals during critical stages in their life cycle. In complex ecosystems where many species rely on each other, the impacts can be cascading. A recent study found that rising temperatures were associated with earlier spring migration in birds, potentially throwing them out of sync with the peak abundance of insects they eat or the blooming of flowers they pollinate. Early spring warming can also make plants more vulnerable to damage by subsequent frosts that are still normal for a given area. Known as a “false spring,” this phenomenon resulted in $1 billion of losses in fruit crops across the Southeast United States in 2017. Phenology is one of the oldest kinds of environmental science, and it could be more important than ever for monitoring how the natural world is responding to a changing climate.
Earlier springs have implications for us, too. Check out our previous releases:
A longer growing season means a longer allergy season
Earlier springs mean pests (like mosquitoes) could persist for longer periods
POTENTIAL LOCAL STORY ANGLES
When is spring blooming near you?
Check out the “springcasting” tools at USA National Phenology Network, an organization of citizen scientists, government agencies, non-profit groups and others, who monitor seasonal changes in the natural world. USA-NPN tracks the onset of spring across the country and has historical, real-time, and forecasted phenology maps. These are important tools for forecasting invasive species and pests, allergy outbreaks, and informing agricultural calendars.
Tools for reporting on phenology in your local area:
Citizen or volunteer scientists are essential for tracking the seasonal changes in plants and animals, and USA-NPN’s Nature’s Notebook website provides all the tools necessary for locals to start recording their observations.
The pollen is coming! Here’s how to track it near you:
Nearly 25 million people in the U.S are estimated to have asthma, and research suggests that climate change might already be contributing to longer pollen seasons and increased pollen concentrations. You can search for local pollen counts and sign up for pollen level alerts through the American Academy of Allergy, Asthma, and Immunology. And check out Climate Central’s Media Library for local data and graphics on changing allergy seasons and other pollen resources.
EXPERTS TO INTERVIEW
LOCAL INTERVIEW IDEAS
Find the certified phenology leaders near you who report local observations to USA-NPN’s Nature’s Notebook monitoring program. Public gardens around the country are staffed by experts and many maintain active plant records systems; find public gardens near you through the American Association of Public Gardens. And the Garden Club of America has 201 local clubs throughout the country.
The SciLine service,500 Women Scientists or the press offices of local universities may be able to connect you with local scientists or climatologists who have expertise on changing climate patterns in your area. The American Association of State Climatologists is a professional scientific organization composed of all 50 state climatologists.
You can find local allergists and immunologists through the American Academy of Allergy, Asthma & and Immunology.
NATIONAL INTERVIEW SUGGESTIONS
Theresa M. Crimmins, PhD
Director, USA National Phenology Network and Nature's Notebook, National Coordinating Office, University of Arizona
Email: theresa@usanpn.org
Phone: (520) 621-8523
Dist. Prof. Mark D. Schwartz, PhD
Climatologist and phenoclimatologist, Department of Geography, University of Wisconsin-Milwaukee
Co-founder of the USA National Phenology Network
Email: mds@uwm.edu
Phone: (414) 229-3740 or 4866
American Academy of Allergy, Asthma, & Immunology
Contact AAAAI’s media office to arrange interviews with national allergy experts and for experts available for interviews in Spanish
media@aaaai.org
(414) 272-6071
METHODOLOGY
Annual first leaf Spring Index data (1981-2019) for the Contiguous United States was obtained from the USA National Phenology Network. Trends were calculated using linear regression analysis and results were rounded to the nearest whole number.