Climate Matters•February 8, 2017
Snow Records & Trends
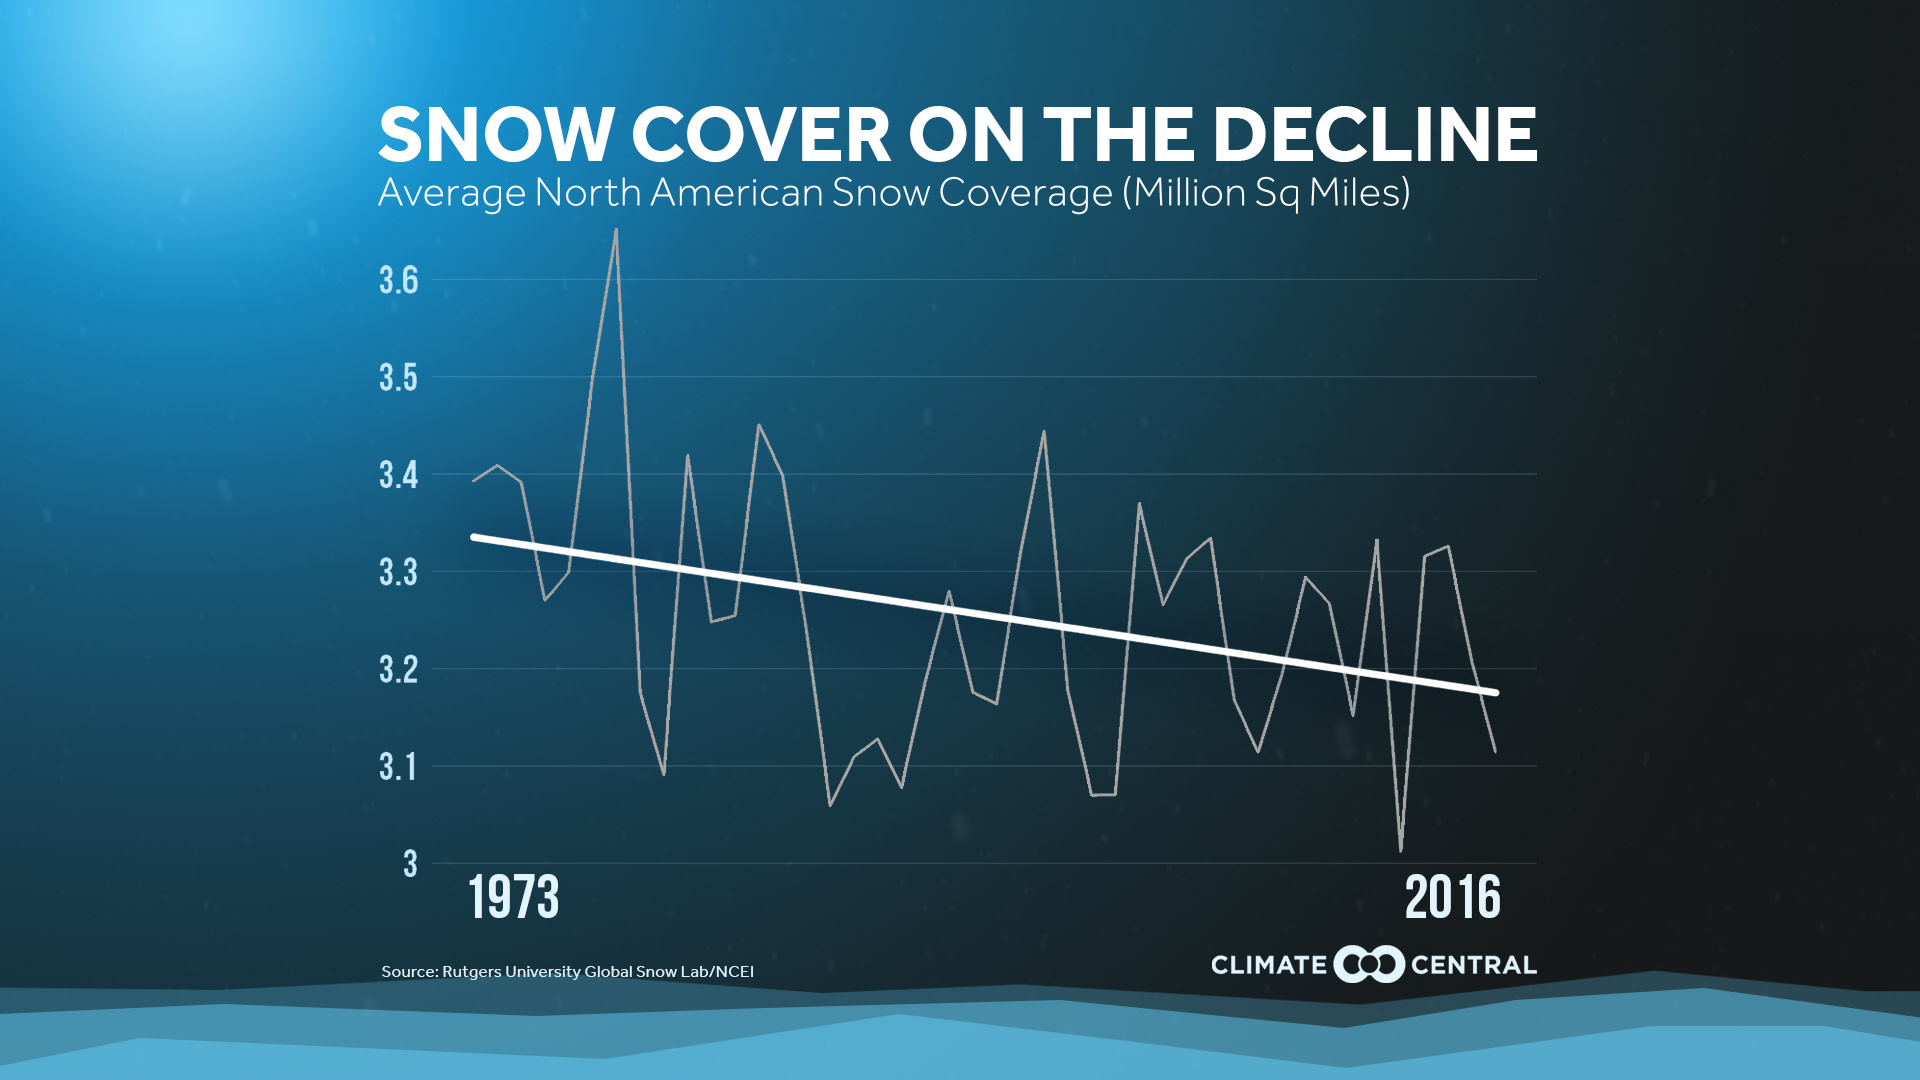
As the world warms, the overall area of North America covered by snow is decreasing. One reason is that an increasing percentage of winter precipitation is falling as rain instead of snow in many locations. A Climate Central report found that between sea level and 5,000 feet in elevation, a smaller percentage of winter precipitation is falling as snow in the western U.S. The subsequent decline in snowpack affects reservoir levels and irrigation, as the melting snow provides water for the West in the dry summer months.
However, the relationship is more complex at the local level. Rising temperatures can cause some individual storms to produce more snow. That’s because for every 1°F rise in temperature, the atmosphere can hold 4 percent more water. This, in turn, means more water is available to fall as snow or rain.
In the Great Lakes region, warming is leading to more snow in some of the downstream areas. When the lakes go longer without forming ice, that allows for increased evaporation, and the potential for more lake-effect snow.
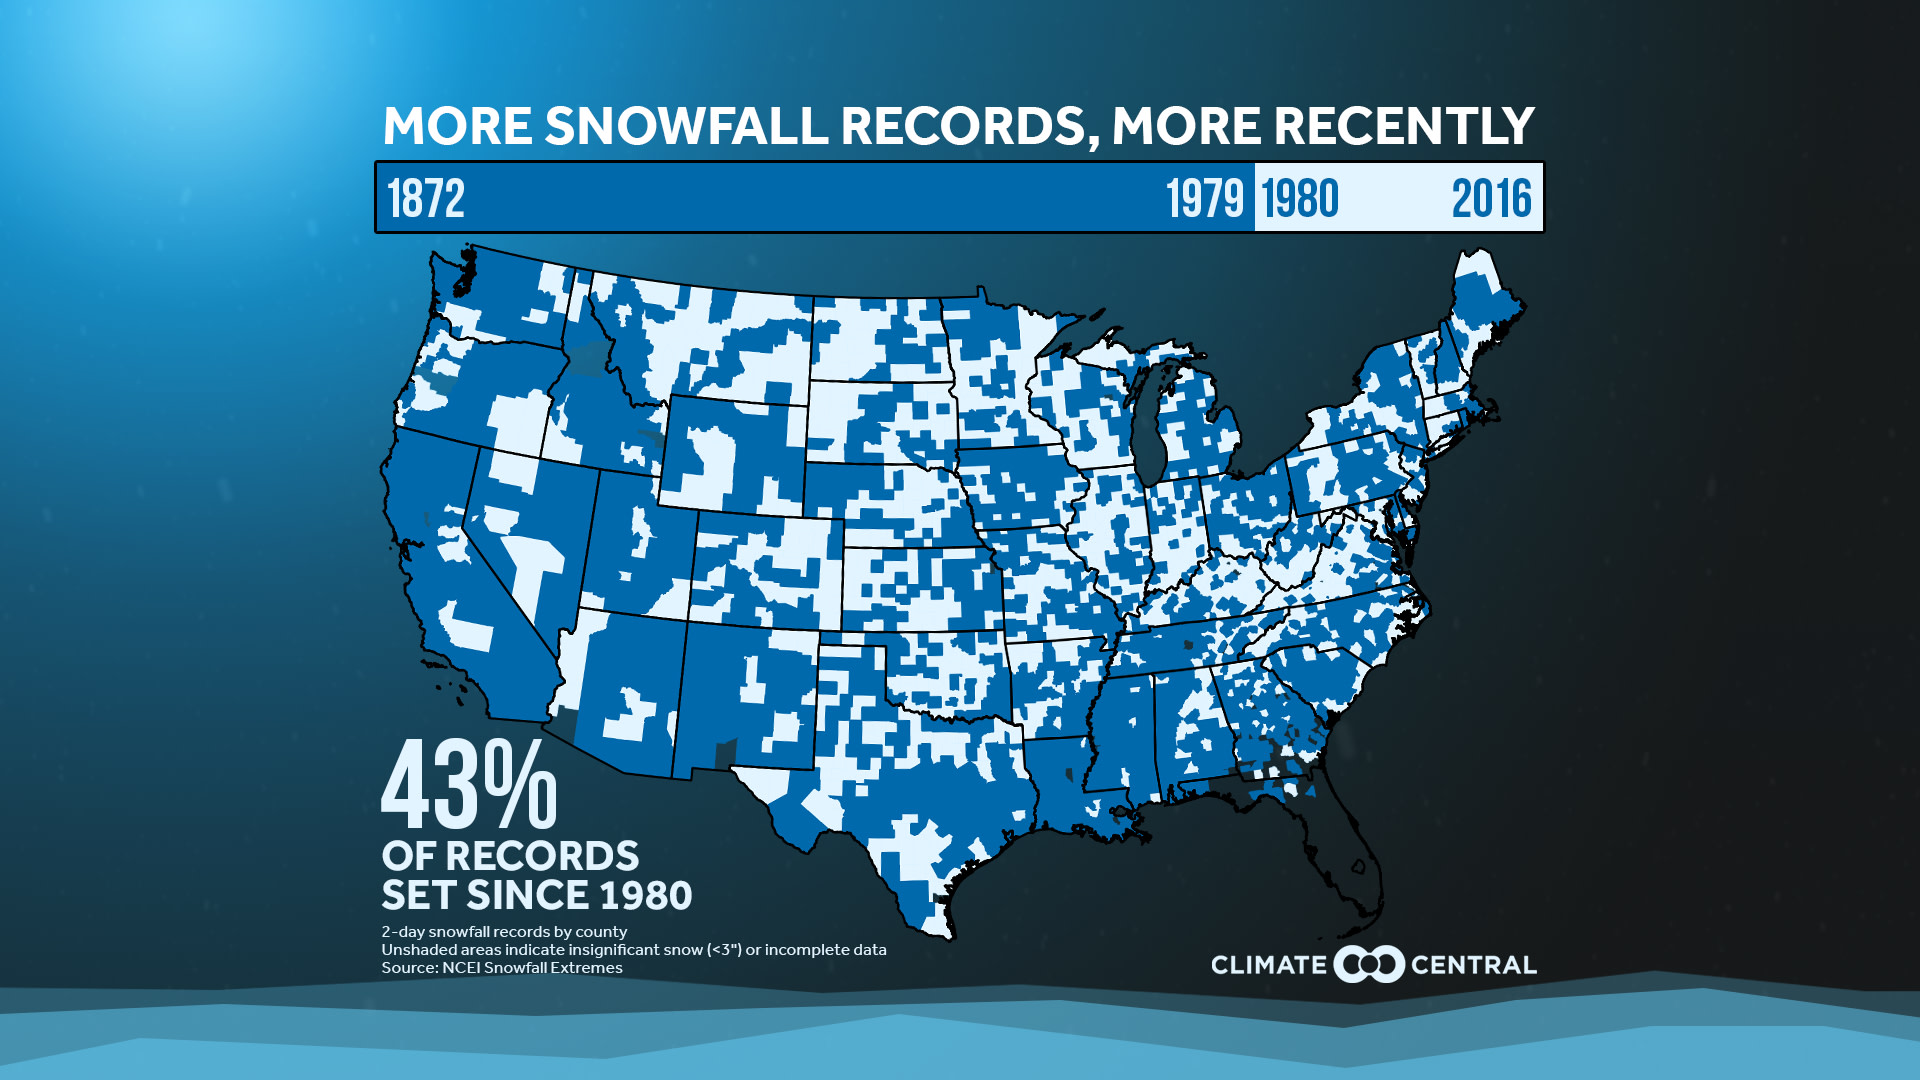
Nationwide, more than 40 percent of counties have had their biggest 2-day snow totals since 1980. Our analysis excluded counties where the 2-day snowfall record was less than 3 inches. So even if the average amount of snow at the local level may be trending down, the snow that falls may come in larger batches. This is notable in the northeastern cities, where the biggest storms are usually nor’easters, which tap into the Atlantic Ocean for moisture. As the Washington Post’s Capital Weather Gang has pointed out:
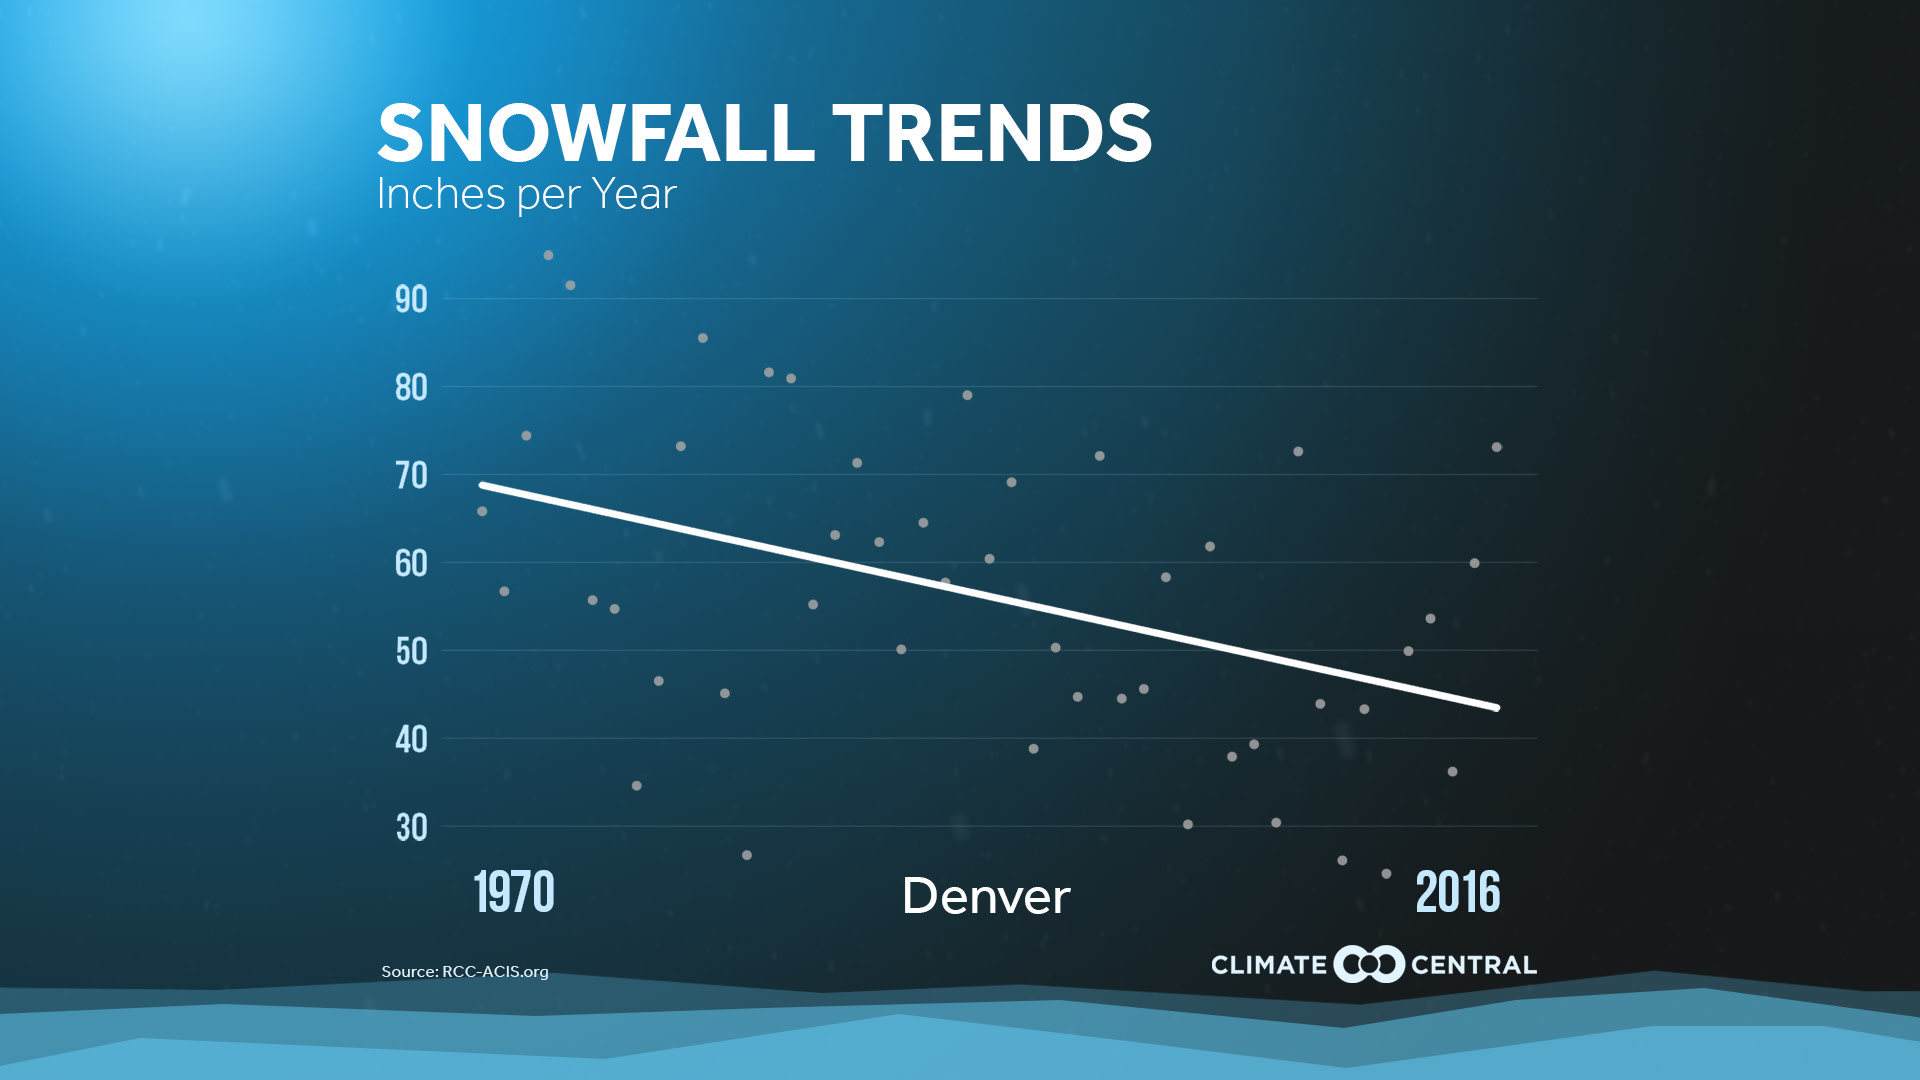
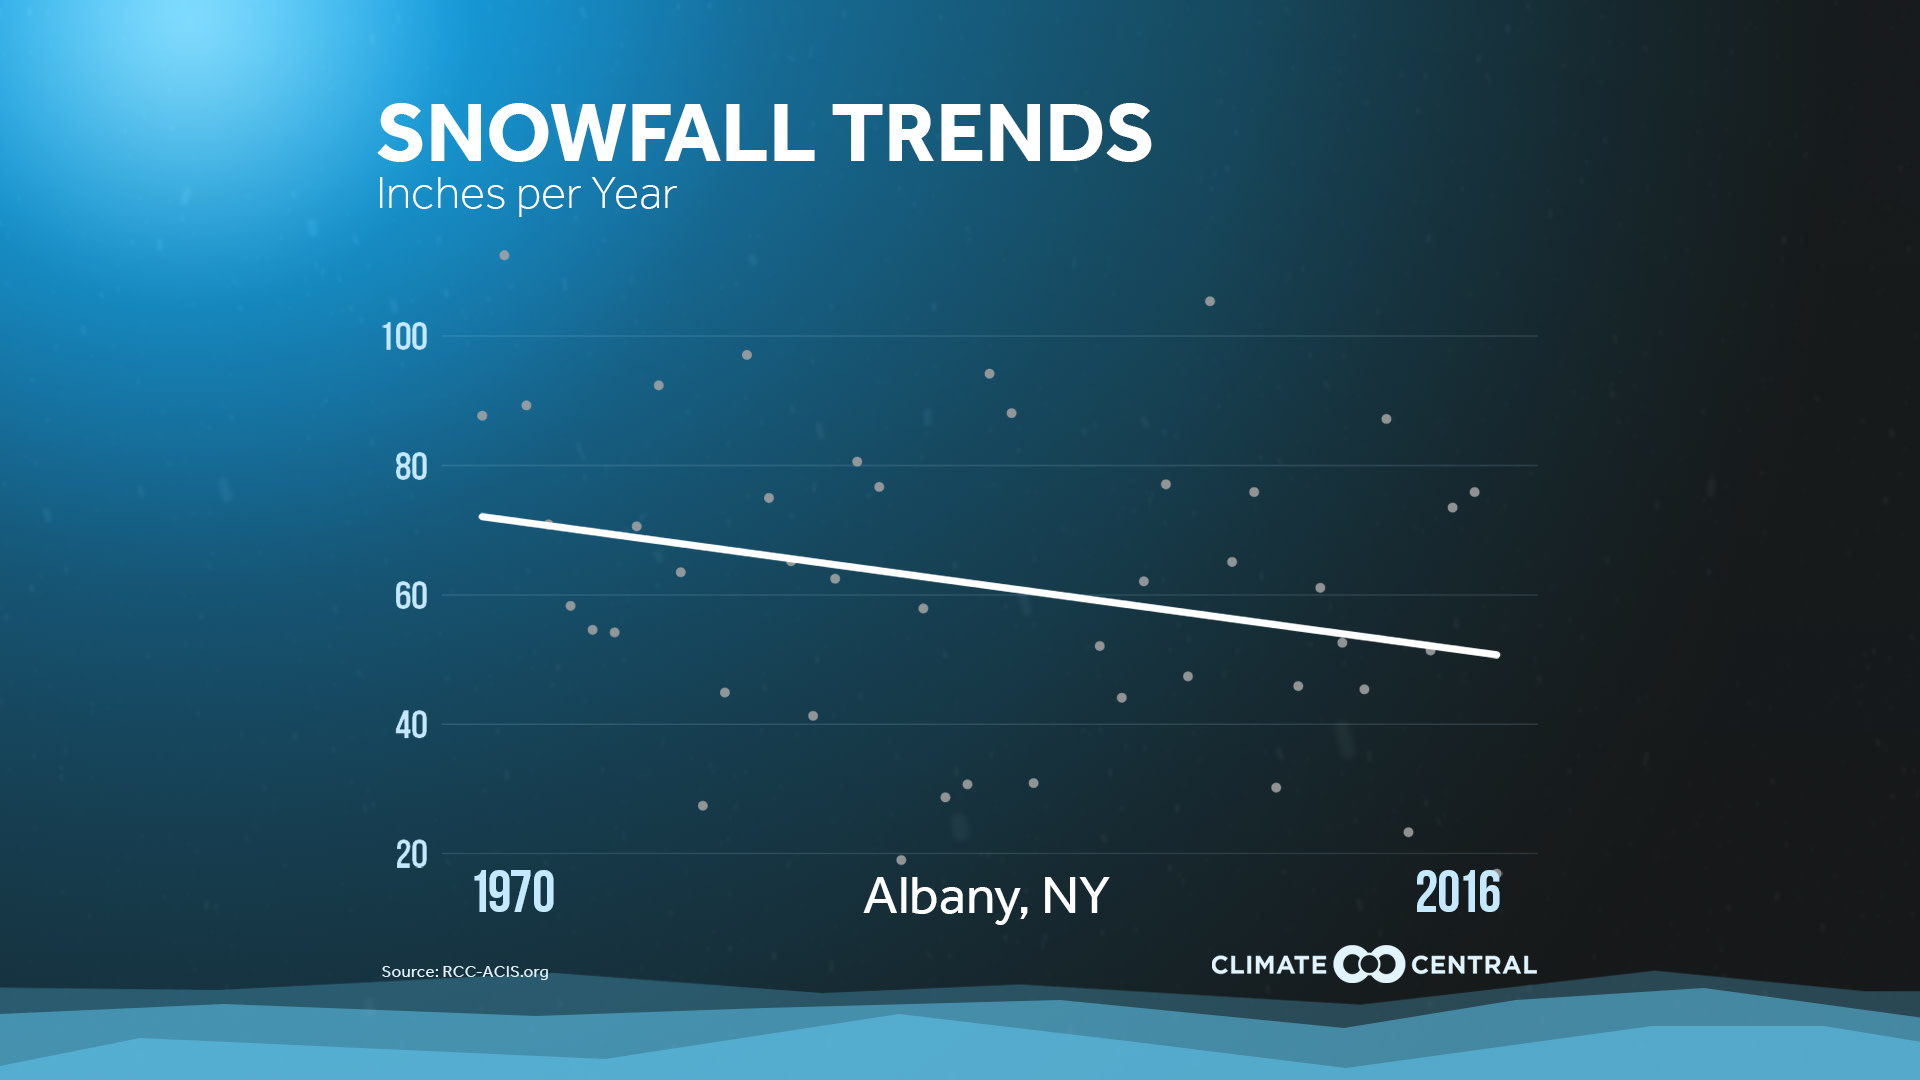
Local Snowfall Trends (where applicable): Total snowfall is over the period from July - June in areas which average at least 10 inches of snow per year. Data is from the Applied Climate Information System.
North American Snow Cover: Data is from Rutgers University Global Snow Lab obtained from NOAA NCEI. Each point represents the average over a year from July - June. Data begins in 1973 as it was the first year with reliable widespread available data.
Record Snowfall: 2-day (calendar) total snowfall records by county are represented in locations with a minimum record threshold of 3 inches. Data is from NOAA NCEI.