After last week’s release of global temperature data placing 2019 as Earth’s second hottest year and the 2010s the hottest decade on record, news of record-breaking temperatures doesn’t seem to be going anywhere. It’s been unseasonably warm throughout the eastern United States, with all-time record high January temperatures registered in places as far flung as Boston, Mass. to Naples, Fla.
Rising temperatures sometimes seem most noticeable during periods of extreme heat such as summer heat waves. However, for much of the U.S., winter is the fastest warming season. Cold weather still occurs in a warming climate but, on average, winters are not as cold as they used to be and cold snaps that do happen are becoming shorter and less frequent.
Title: JPG • PNG| No Title: JPG • PNG
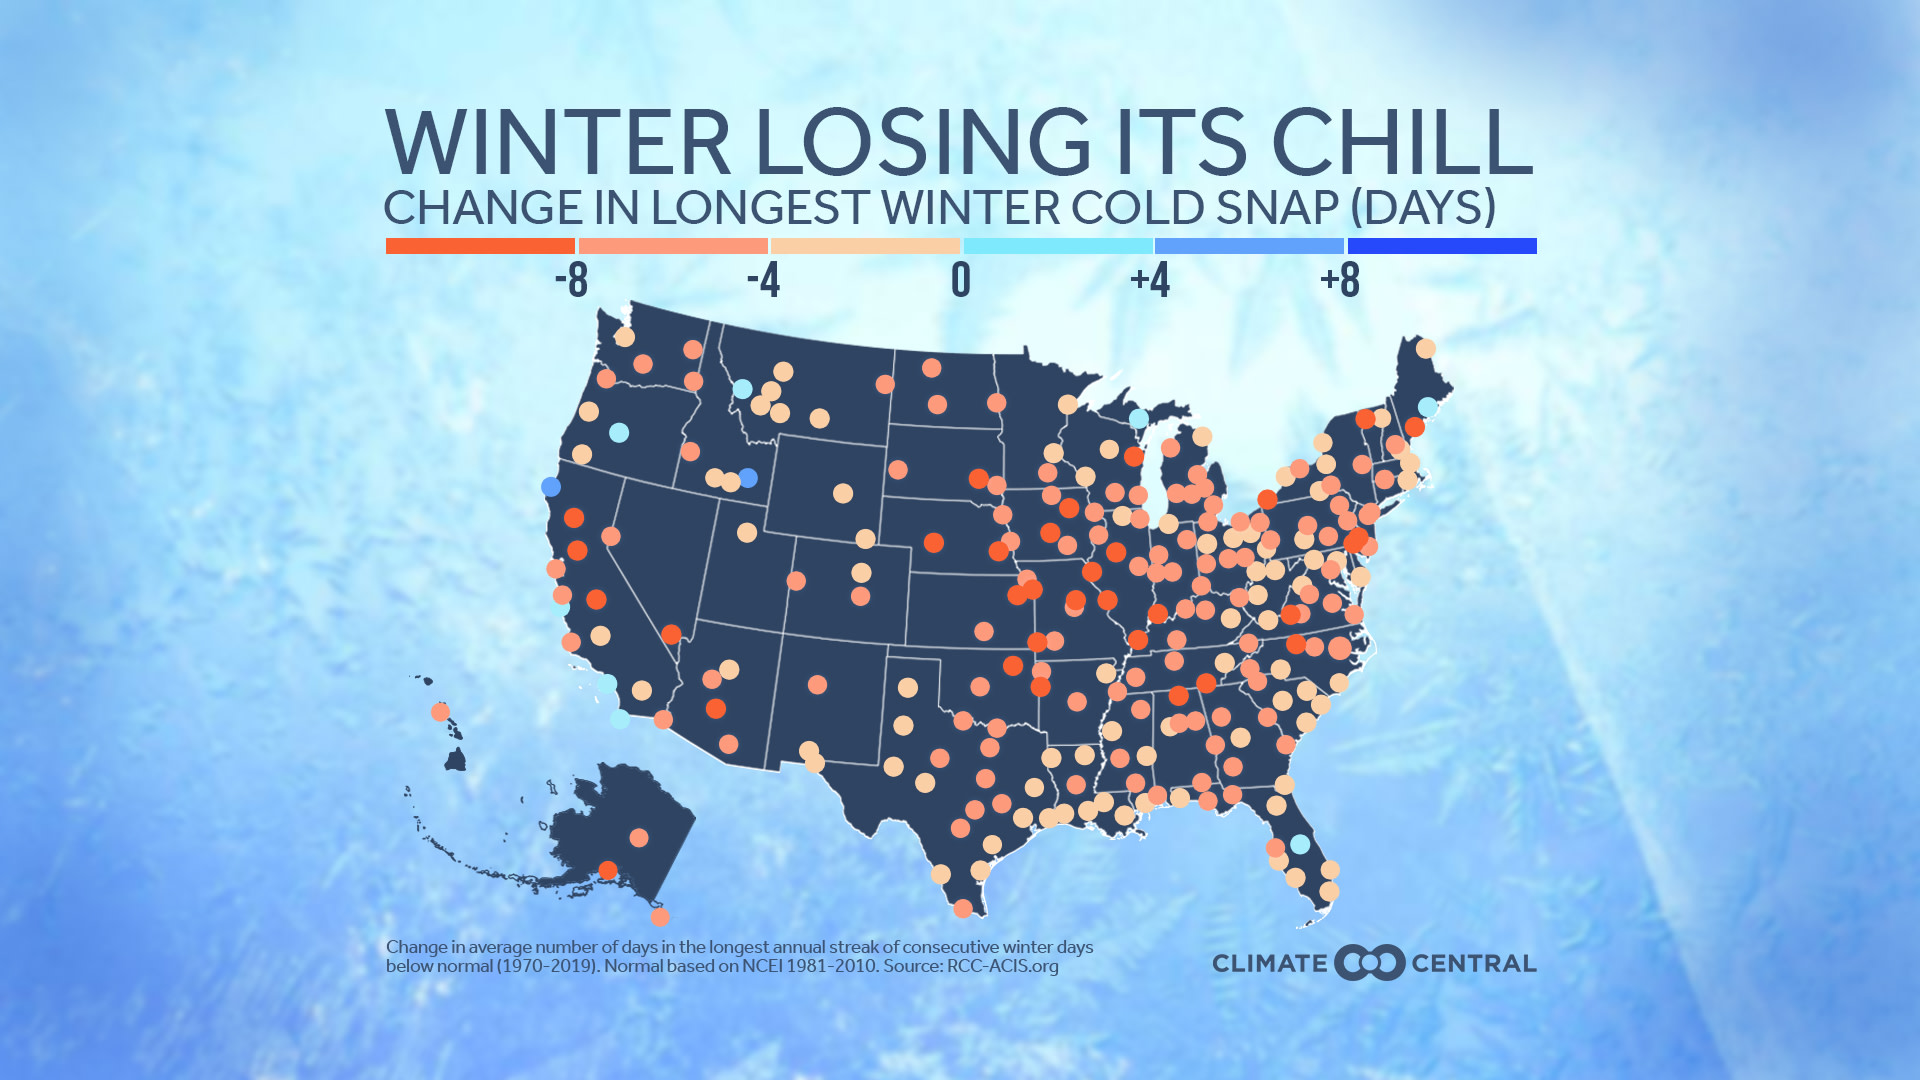
This week, we analyzed how the number of consecutive winter days below normal have changed across the U.S. since 1970. Of the stations analyzed (242), we found that 96% (232) experienced shorter cold streaks, with the average trend across stations showing a reduction by almost five days. Locations experiencing shorter periods of cold aren’t concentrated in any one part of the country, with Las Vegas showing the greatest losses with approximately 18 fewer cold days, followed by Topeka, Kan. (13 days), Chico, Calif. (13 days), St Louis (12 days) and Philadelphia (12 days).
Warmer winters may seem like an inviting prospect, but they come with consequences that aren’t always immediately obvious. Cold temperatures are important in limiting pest populations--which is why many parts of the country have experienced expansions in mosquito seasons. Periods of consistent cold are important for the plant development - for instance, fruit trees (such as apple, peach and cherry trees) rely on this time of dormancy in order to produce fruit the following spring and summer. Some local communities also depend on cold weather for the success of winter-based economies, such as ski resorts, as well as for the continuity of traditional and indigenous practices, such as ice fishing.
METHODOLOGY: Winter data (December, January, and February) were collected from the Applied Climate Information System. The graph indicates each year’s highest number of consecutive winter days below the 1981-2010 NOAA/NCEI climate normal. Displayed trend lines are based on a mathematical linear regression.
