Climate Matters•October 4, 2018
Rising Tides

READ THE FULL RESEARCH BRIEF: RISING TIDES: How Near-Daily Flooding of America’s Shorelines Could Become the Norm
“King Tides,” the highest astronomical tides of the year, are just around the corner — as the Earth, moon, and sun line up for peak gravitational pull on the oceans. Ocean currents and topography also play a role in when these peaks occur and how high they get. On the East and Gulf Coasts, they tend to come in October, while on the West Coast, they often arrive in December. These peak tides are more frequently flooding the coasts, even in the absence of a storm to drive waters higher. The flooding is increasingly affecting coastal area property values, degrading coastal infrastructure, and increasing salinity levels along coastal water tables, killing trees in coastal forests and contaminating freshwater supplies with saltwater.
Climate change has already increased the frequency of coastal flooding, including floods just from tides. The combination of water expansion as the ocean has warmed and the melting of land ice into the oceans has driven sea level up about seven inches since 1900, and the rise is accelerating. From 2005 to 2015, the median annual number of flood days more than doubled along the stretch of coast from Florida to North Carolina. This flooding will become even more common in the near future since the amount of greenhouse gases emitted into the atmosphere today will increase sea levels for years to come.
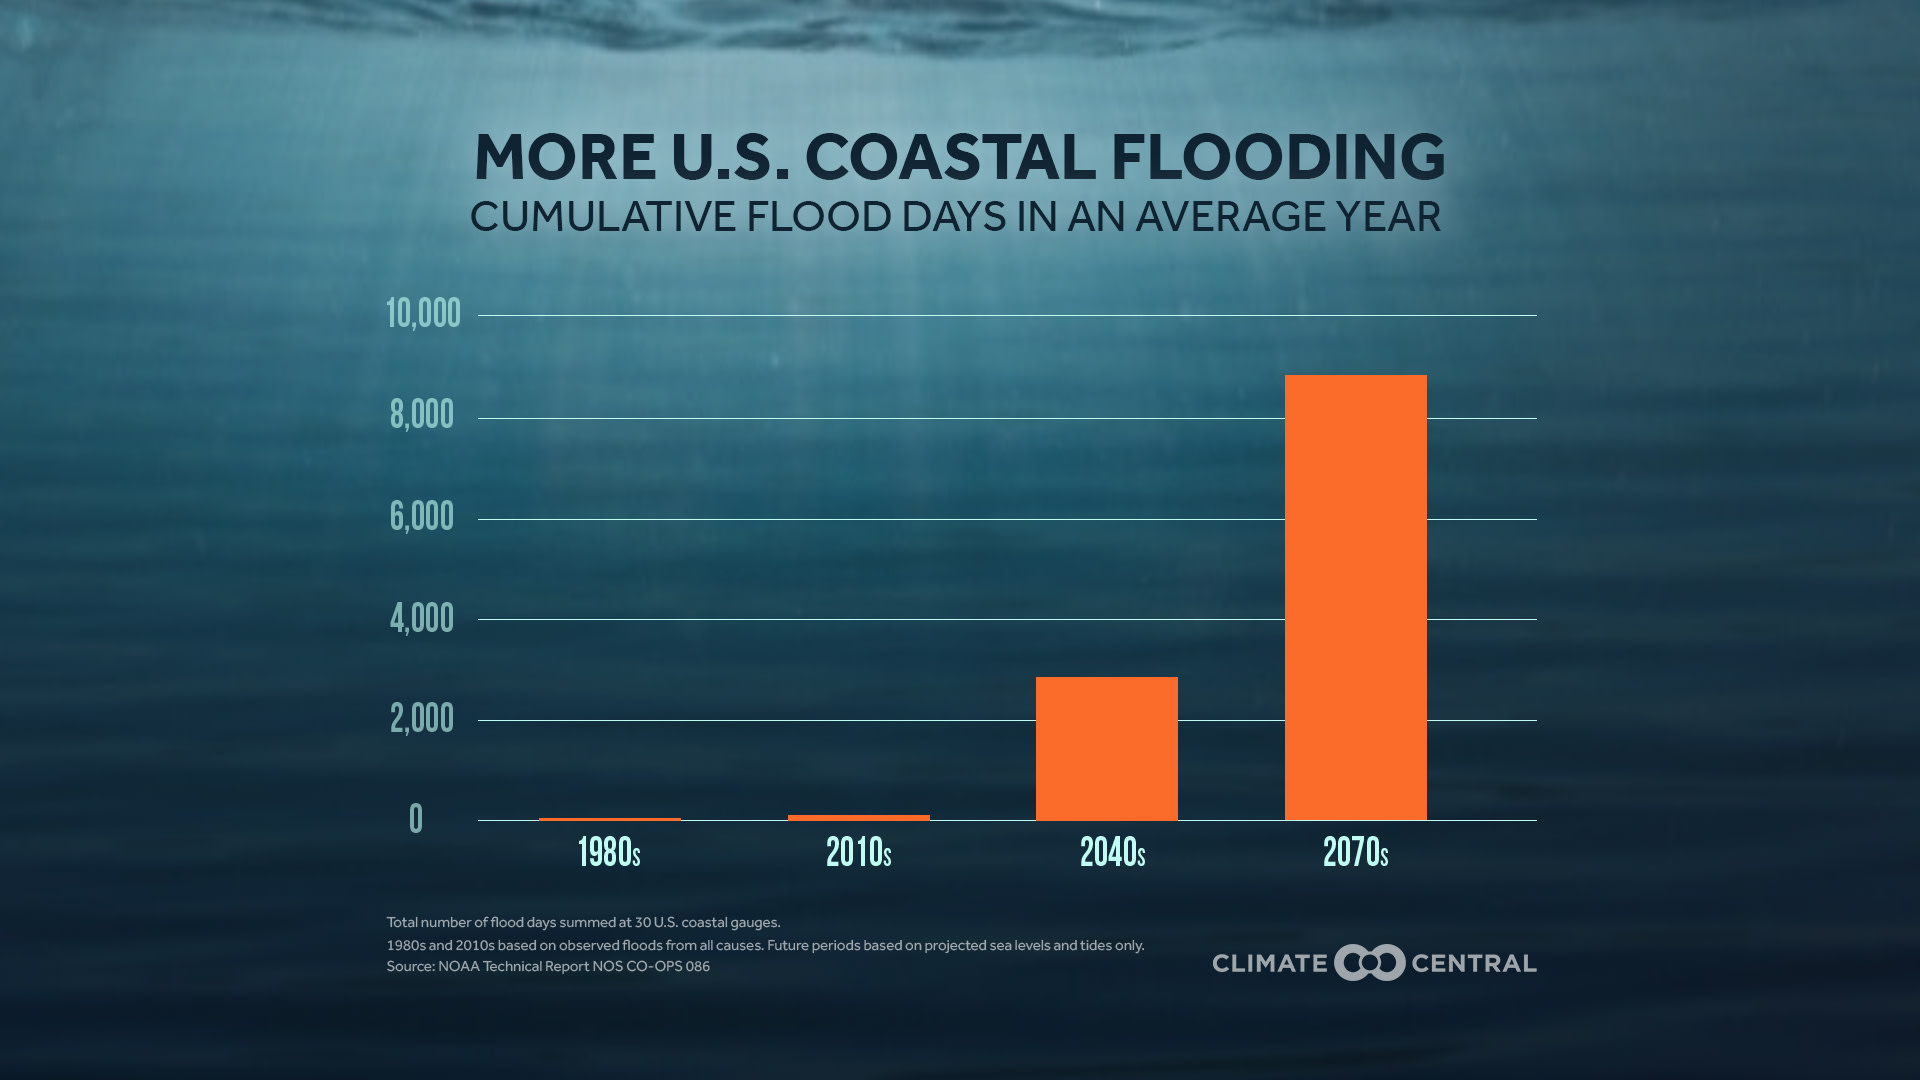
Sea level rise projections vary, depending on the amount of greenhouse gases emitted. Climate Central used NOAA’s data on the projected number of annual coastal floods based on NOAA’s “intermediate” sea-level rise scenario of 3.3 feet by 2100 and found the average number of flooding days due to sea-level rise plus tides alone for 30 U.S. coastal locations for given decades by the end of the century. In an average year in the 2010s, those 30 sites experienced a total of 153 days of floods. In an average year in the 2040s, they would see around 2,850 floods — and that latter figure reflects only floods driven by sea-level rise and high tides, excluding the effects of storm surges (storm surge effects are included in observations for the 2010s and earlier). By 2100, under this scenario, flooding would take place at high tide every day of the year along much of the East and Gulf Coasts.
Some communities are trying approaches to limit the impacts from sea-level rise. Living shorelines, or the restoration of natural features like oyster reefs, salt marshes, and seagrass, slow down erosion and protect nearby infrastructure. Road surfaces are already being elevated in anticipate of inevitable sea level rise in South Florida. City planners in Annapolis, Maryland have discussed ways protect the city’s historic dock, from improving storm drain systems to elevating some urban features.
See graphical representations of sea level rise impacts at individual sites along the coast using our Surging Seas website.
Methodology: Observed water levels were used to count present and past floods, which were driven by tides along with storm surges. Future hourly water levels are based on detailed tidal projections and sea level rise projections.
Days were counted as flood days if a site’s daily maximum water level exceeded NOAA’s location-specific derived minor flood threshold. To represent a typical October/December month for a given decade, the year with the number of flood days at the median for that decade was selected and represented on the calendars.
For a complete methodology, click here.