Climate Matters•November 10, 2021
2021 Record Rain Days

KEY CONCEPTS
72% of 246 locations evaluated have seen an increase in the amount of rain falling on their annual wettest day since 1950, especially in the Gulf Coast and Mid-Atlantic.
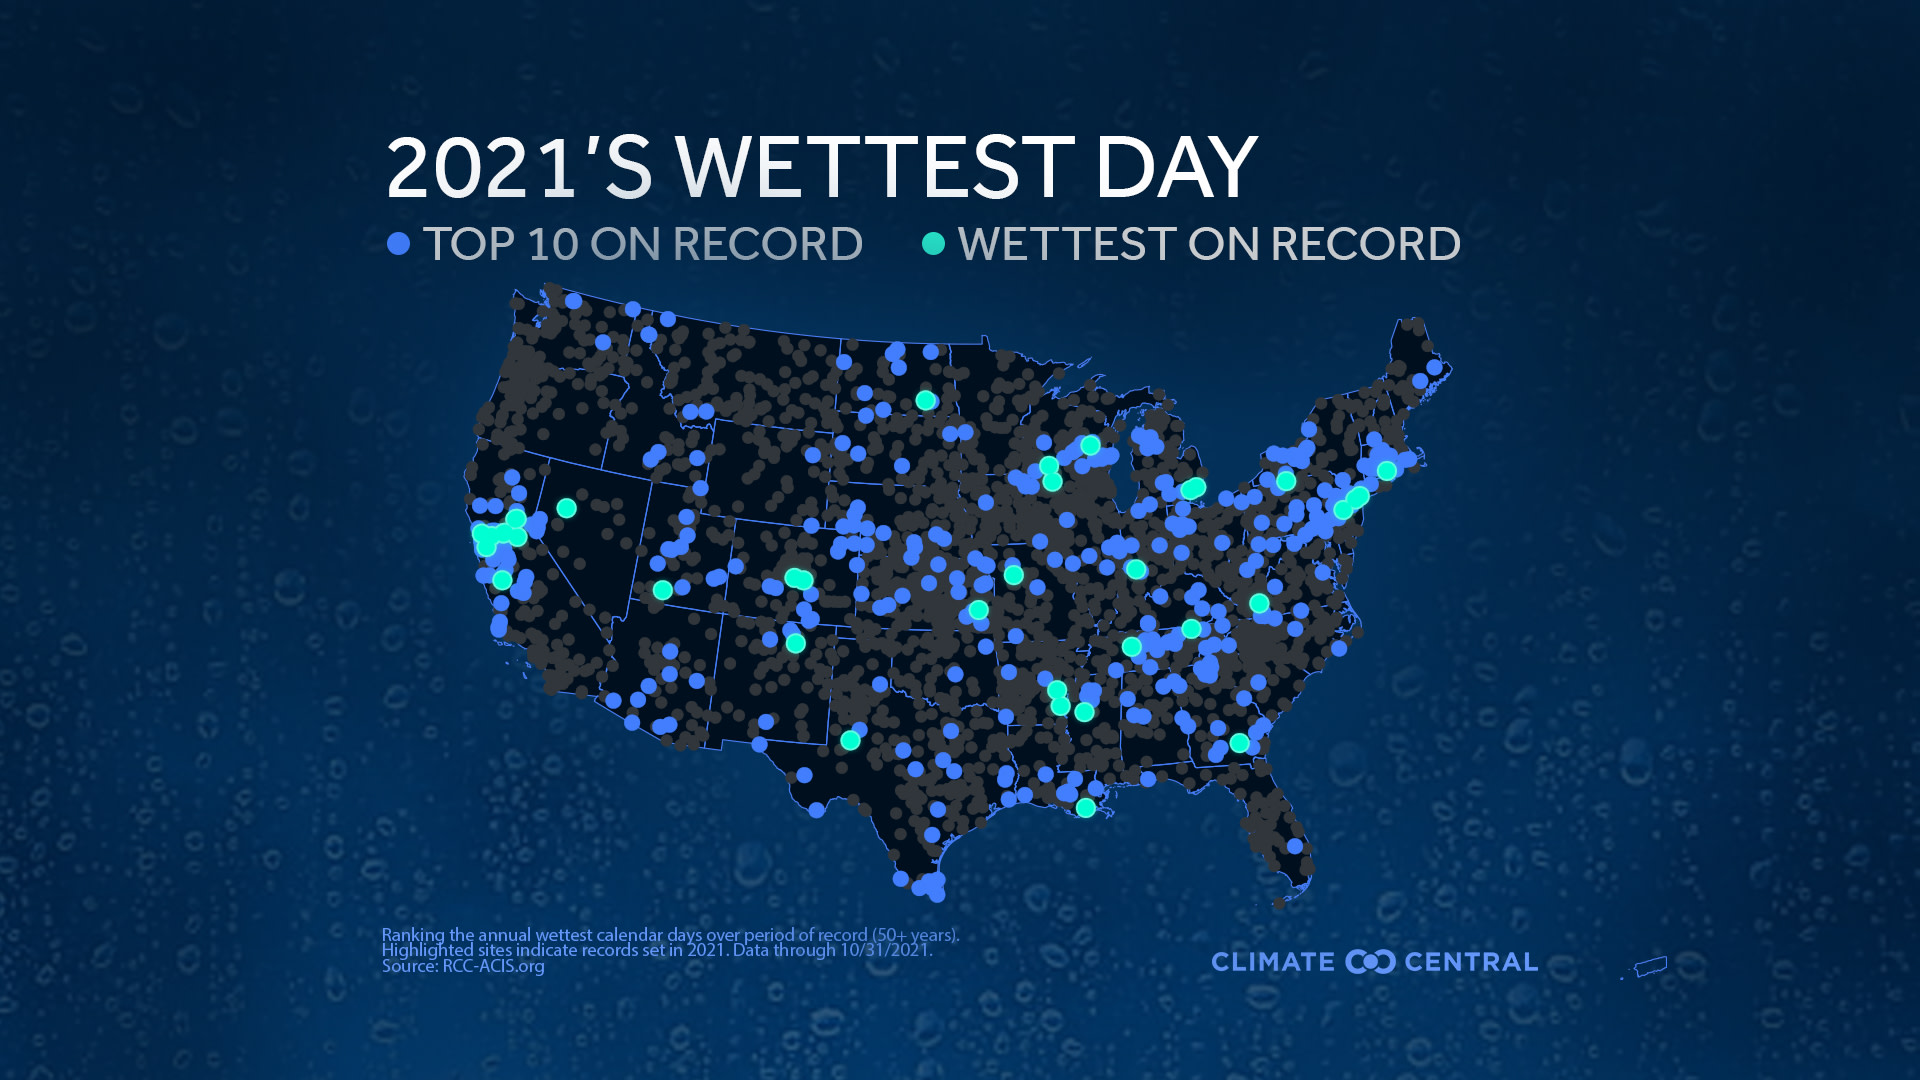
A broader analysis of 2568 stations shows that, in 2021, 15% had one of their top ten annual wettest days on record. Thirty-seven of those sites took the top spot.
A warmer atmosphere can hold more moisture, increasing the potential for heavier downpours.
Flooding and mudflows brought by heavy rains can cost billions in damages, threaten public health, and exacerbate racial and socioeconomic inequities.
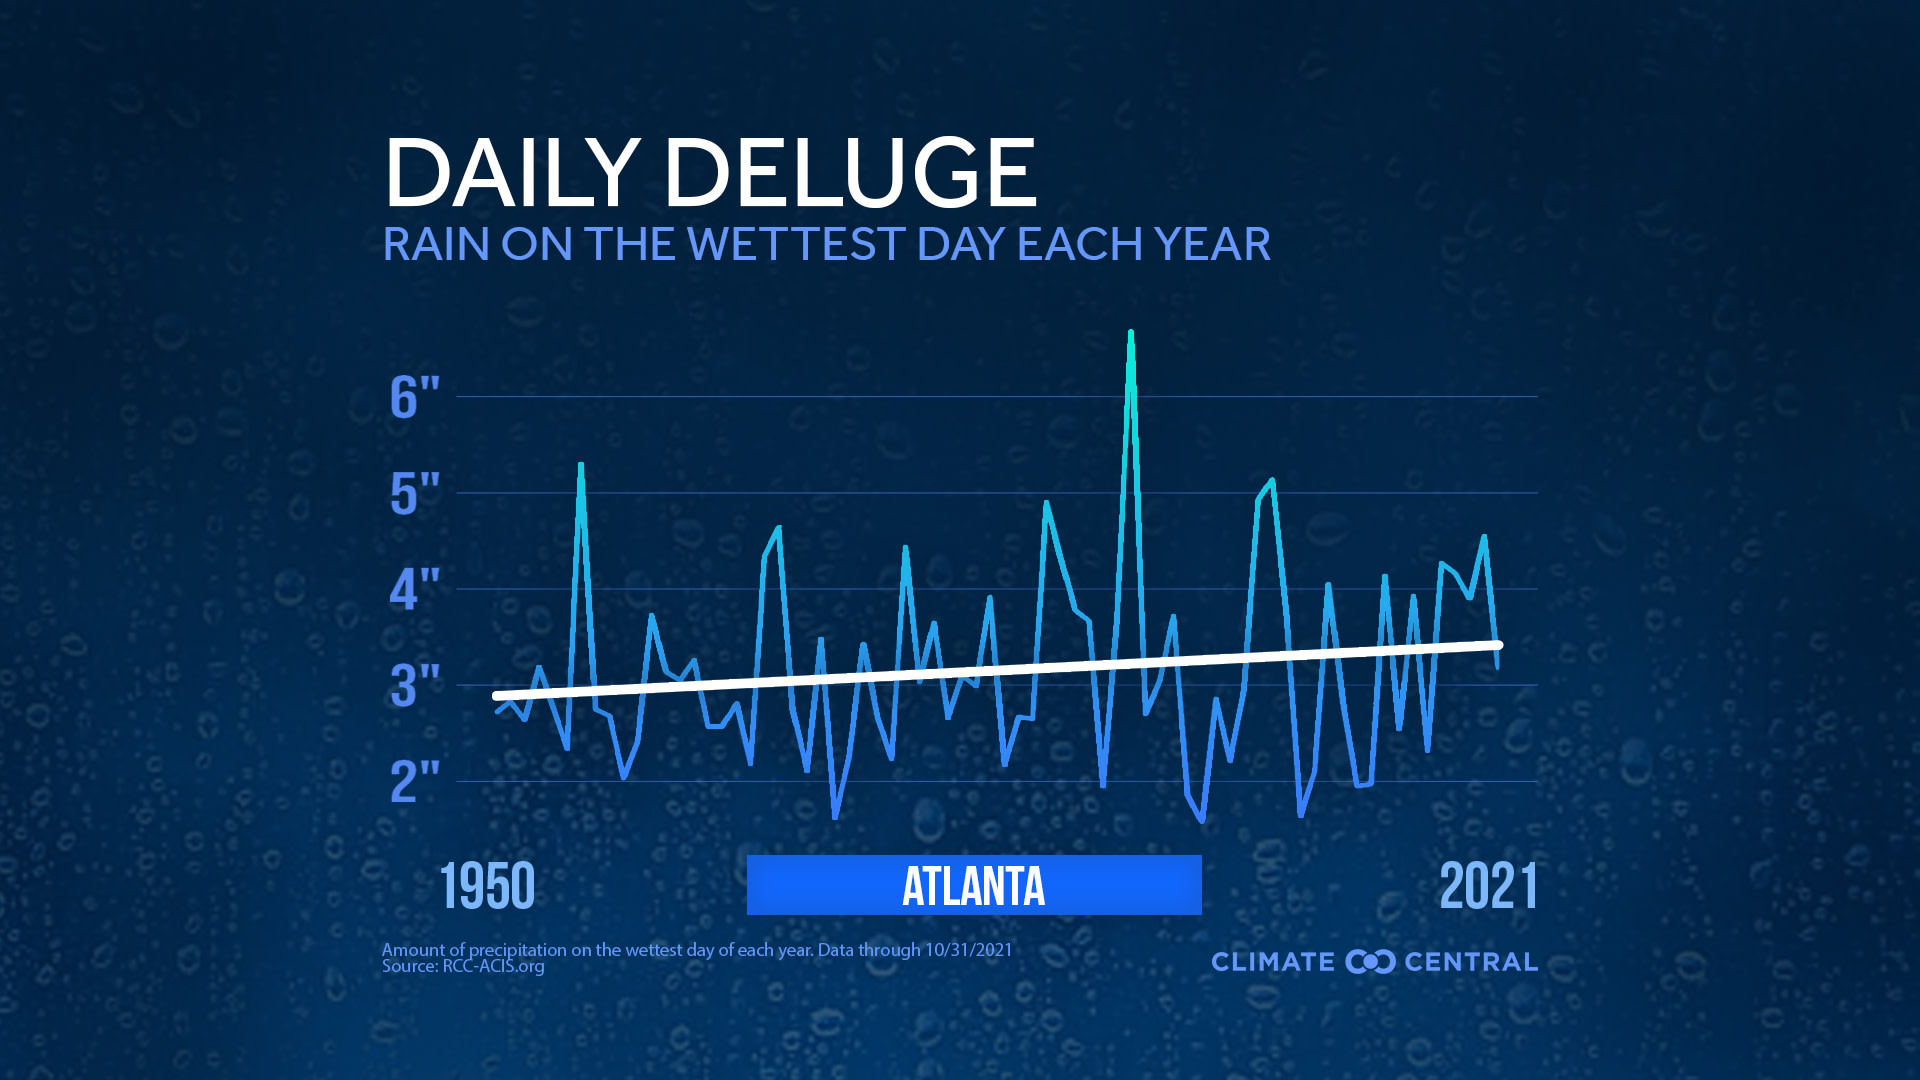
Some of the heaviest rains have been getting heavier since 1950.
Climate Central found that 72% (178) of 246 locations analyzed have seen an increase in the amount of rain falling on their annual wettest day since 1950.
Locations along the Gulf Coast and Mid-Atlantic have experienced the greatest increase by volume in their heaviest rainfall events. Houston tops the list with 2.8 additional inches on its annual wettest day compared to 1950, or an 83% increase. This is followed by Greenville, N.C., Pensacola, Fla., Hattiesburg, Miss. and Baton Rouge, La.
These trends are consistent with long-term increases in the amount of precipitation falling in the heaviest one percent of downpours across the country, with the largest increases in the northeastern U.S.
2021 has been a record-breaking year for extreme rainfall events from coast to coast.
For 15% of 2568 stations evaluated across the contiguous U.S., their wettest day of 2021 ranks in their top-ten annual wettest days on record.
Through the end of October, 37 of these locations (including Sacramento, Calif., Newark, N.J. and La Crosse, Wis.) experienced their wettest day since 1950.
Record-setting rainfall in the Northeast looks different than in the more arid West. For example, Sacramento’s record-setting 5.4” downpour on October 24th accounted for 48% of the city’s year-to-date rainfall, while Newark’s record-setting 8.4”on September 1st comprised only 16% of the city’s year-to-date rainfall.
Rising temperatures and extreme rainfall are linked.
A warming world leads to more-intense periods of both extreme rainfall and drought because higher temperatures lead to greater evaporation from land and sea.
For every 1°F increase in temperature, the atmosphere is able to hold about four percent more moisture, leading to more frequent and intense heavy rain events.
The frequency and intensity of heavy rainfall events are projected to increase with additional warming over this century.
Heavy rains bring many risks, including flooding and mudflows—even in the driest places.
Economic loss: Flooding is one of the costliest weather-related hazards in the U.S., causing $43 billion in damages over the last five years (2016-2020). Precipitation extremes are estimated to be responsible for over one-third of flood damages. Damage to croplands and critical infrastructure during 2019 flooding in eight states along the Missouri River totaled $11.6 billion, becoming one of the most expensive inland flooding events on record.
Threats to public health: Floodwaters can expose individuals to toxic contaminants, water-borne diseases, and dangerous debris. Tennessee floods in August 2021 resulted in over 20 drowning deaths. Exposure to hazards like flooding, mudflows, and extreme precipitation have been linked to increased post-traumatic mental disorders.
Social disruption: Downpours can displace families from their homes, compromise agricultural economies by drowning crops, and prevent access to public services like healthcare and education. The consequences of flooding are exaggerated in poor, rural, and redlined—traditionally, Black and Brown—communities through neglected infrastructure and discriminatory housing and relief policies. The financial and psychological burdens of flood exposure complicate the pursuit of recovery and social mobility.
POTENTIAL LOCAL STORY ANGLES
How vulnerable is your area to flooding?
Factors like local topography, age of infrastructure, watershed health, and precipitation trends influence flood vulnerability. Access NOAA’s accumulated precipitation plots and precipitation anomaly maps for selected areas of interest. A recent report found that one-fourth of critical infrastructure is put at risk of failure by flooding; the American Society of Civil Engineers grades the integrity of infrastructures by state and category. See current flood risks in your neighborhood with FloodFactor’s zipcode-level risk identifier.
Who is disproportionately impacted by heavy rain-related hazards and why?
Flood risks and impacts are outsized in Black, Brown, Indigenous, and poor communities, especially in rural and Southern regions of the US. Homes in redlined areas have a 25% higher flood risk than in non-redlined areas. Poor homeowners and homeowners of color are priced out of neighborhoods where both housing and municipal flood protections are better maintained. FEMA is less likely to approve aid for homeowners with lower incomes and in nonwhite neighborhoods after floods. When aid is approved, nonwhite homeowners receive less on average than white homeowners in comparable geographic and economic situations.
What can you do to protect against flooding and extreme precipitation?
Firstly, know your own risk using the Federal Emergency Management Agency’s flood maps. Individual homeowners can insure their homes, maintain rainwater systems, reduce impervious surfaces on their property, elevate important utilities and equipment, and take on low-cost indoor projects recommended by FEMA. Communities can invest in flood management systems, green infrastructure and watershed restoration.
LOCAL EXPERTS
The SciLine service, 500 Women Scientists or the press offices of local universities may be able to connect you with local scientists who have expertise on CHANGE and climate change. The American Association of State Climatologists is a professional scientific organization composed of all 50 state climatologists. The Association of State Floodplain Managers (ASFPM) has 37 state and regional chapters that can discuss local flood events and policies to mitigate current and future losses from flooding.
NATIONAL EXPERTS
Pablo A. Méndez Lázaro, PhD
Associate Professor, Dept. of Environmental Health at the University of Puerto Rico
Chapter Lead, Fifth National Climate Assessment (U.S. Caribbean)
Discussion topics: extreme event science, public health impacts, urban resilience
pablo.mendez1@upr.edu
Available for interviews in SpanishMichael Wehner, PhD
Senior Scientist, Lawrence Berkeley National Laboratory
Lead Author, IPCC Sixth Assessment Report Chapter 11 (Climate Extreme Events)
Discussion topics: intense precipitation, extreme event attribution and projections
mfwehner@lbl.govJennifer Trivedi, PhD
Core Faculty, Disaster Research Center and Dept. of Anthropology at the University of Delaware
Author, Mississippi After Katrina: Disaster Recovery and Reconstruction on the Gulf Coast
Discussion topics: disaster vulnerability, response, recovery, resilience
jtrivedi@udel.eduKenneth Kunkel, PhD
Research Professor, North Carolina State University
Lead Scientist, National Climate Assessment Technical Support Unit
Discussion topics: intense precipitation, extreme event science
infrastructurekekunkel@ncsu.edu
METHODOLOGY
Using daily precipitation data from the Applied Climate Information System, Climate Central calculated the annual maximum daily (calendar day) precipitation from 1950-2021 (year-to-date through 10/31) for 247 locations. Trends are based on linear regression. While Climate Central's local analyses include 247 stations, for data summaries based on linear trends, only 246 stations are included due to large data gaps in Wheeling, West Virginia.
The national map shows how 2021’s wettest day (year-to-date through 10/31) ranks at over 2500 stations (full station period of record with each needing ≥ 50 years of data) across the contiguous United States.