Climate Matters•May 4, 2022
Peak CO2 & Heat-trapping Emissions
KEY CONCEPTS
Yearly peak carbon dioxide levels will likely break a new record in early May and methane concentrations had their largest annual increase in 2021.
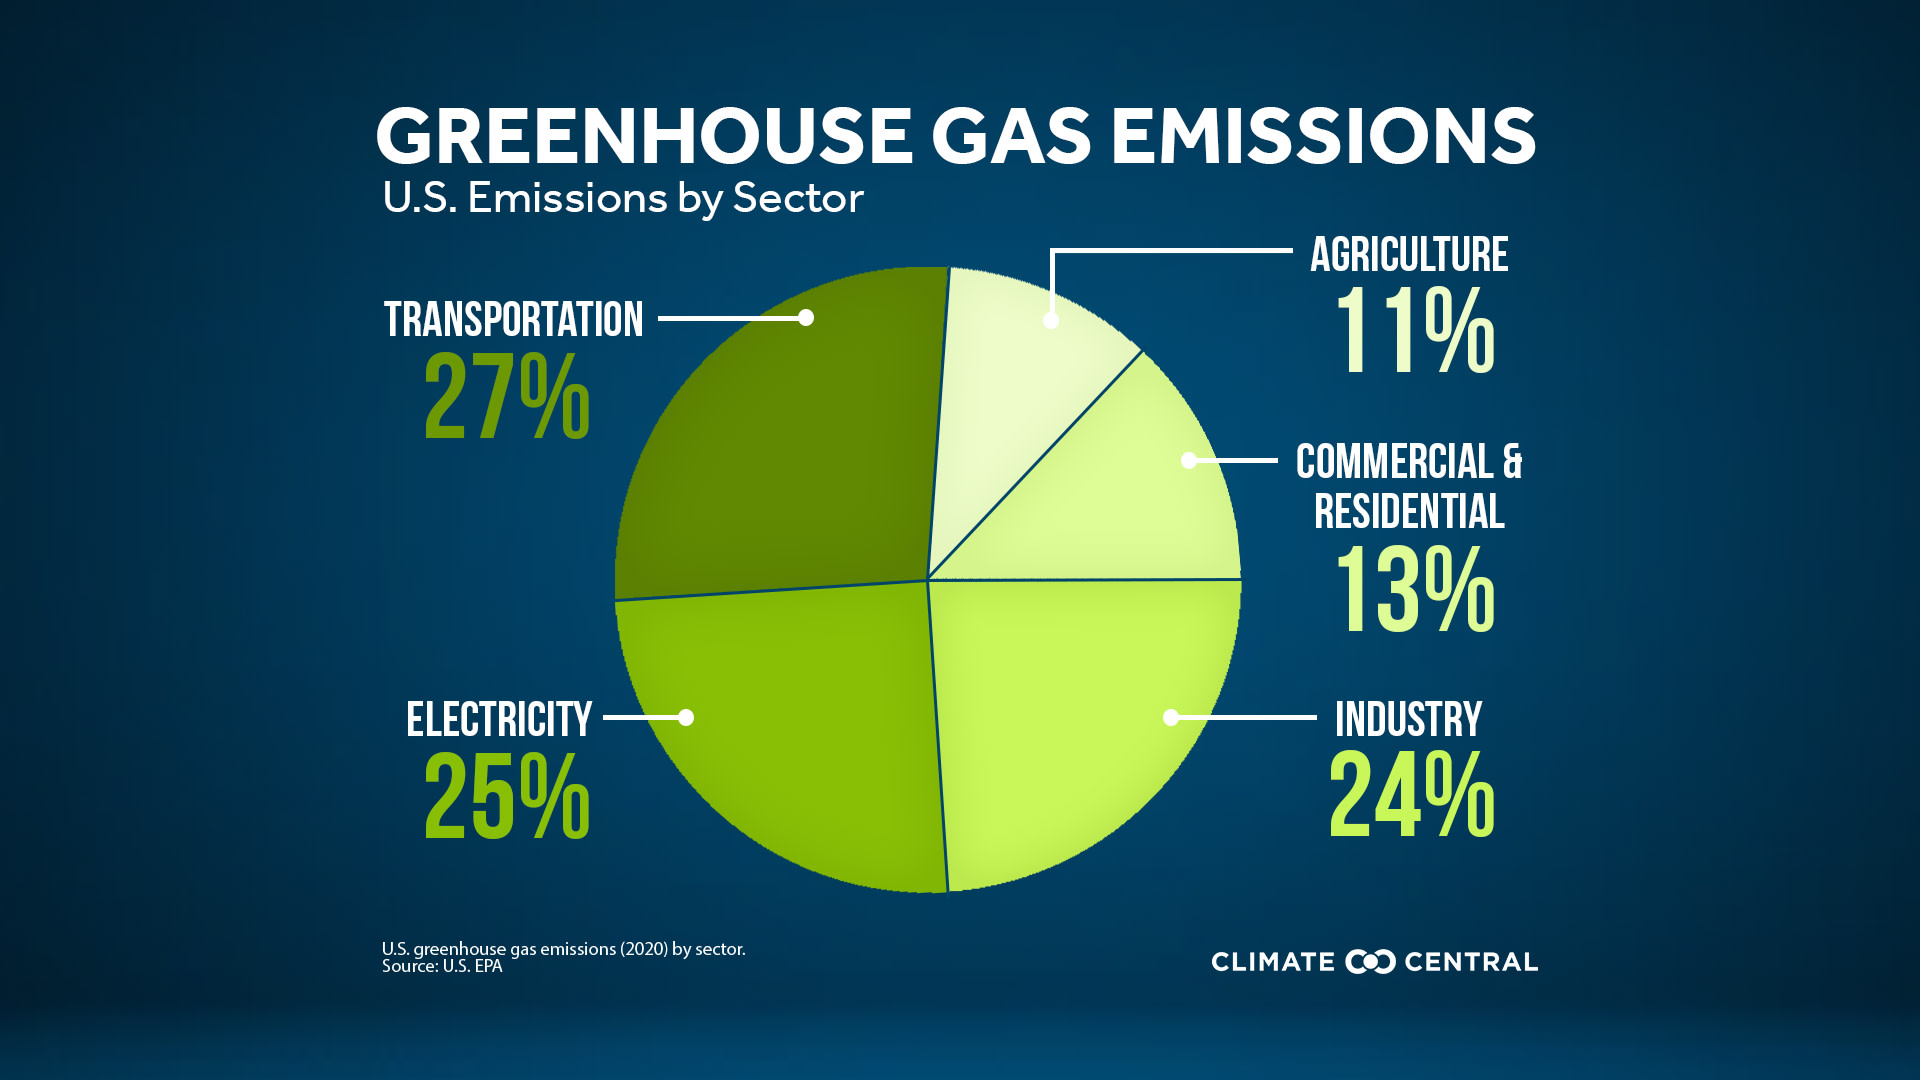
The continued rise of global greenhouse gas emissions is mainly from human activities in five sectors: energy, industry, agriculture, transportation, and buildings. In the U.S., transportation is the largest emitter contributing to 27% of total U.S. greenhouse gas emissions.
We need “rapid and deep” emission cuts across all sectors, globally, if we want a chance at limiting future warming to 1.5°C or below 2°C. If we want a world with the least amount of climate change impacts, we have to take action within this decade.
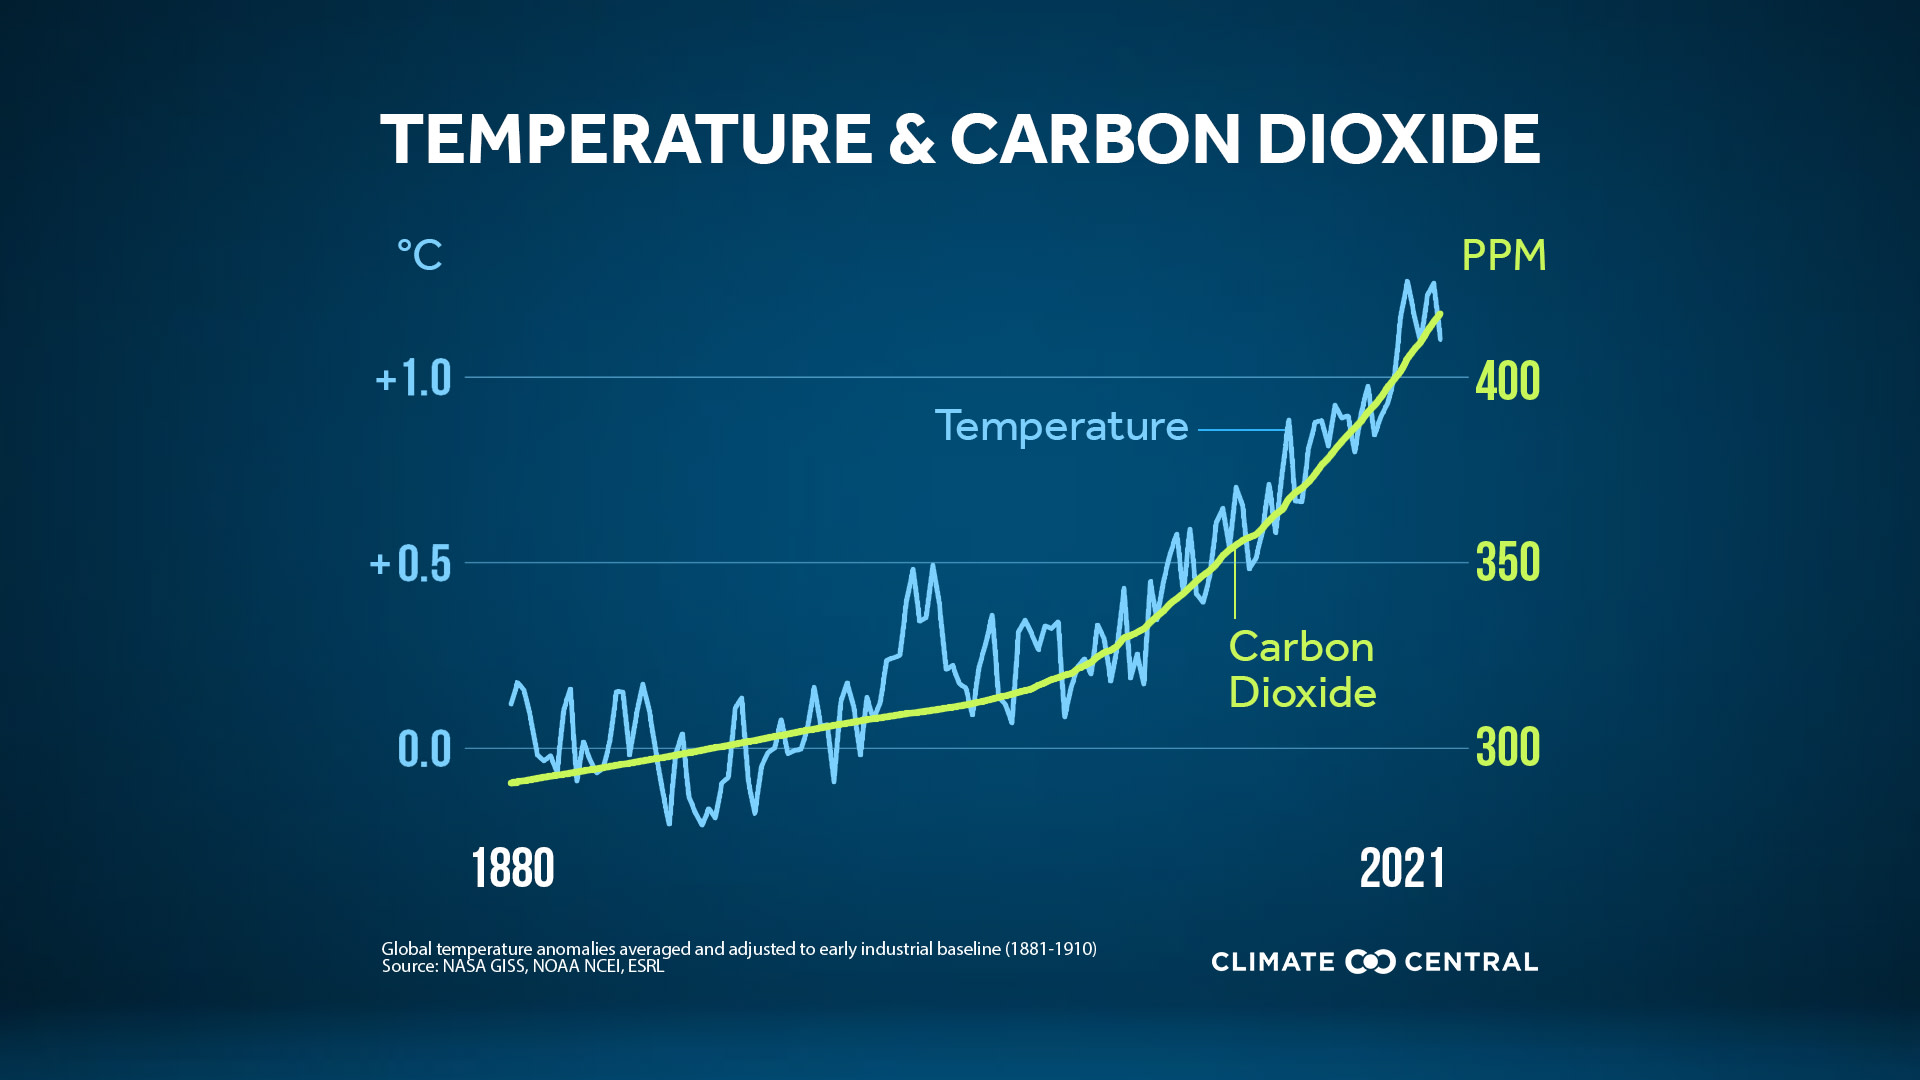
Atmospheric carbon dioxide is on the rise.
For March 2022, the latest monthly data available, average monthly carbon dioxide (CO2) levels reached 418 ppm (parts per million) compared to 417 ppm in March 2021. CO2 levels peak annually in early May. In May, we anticipate that average monthly CO2 concentrations will break last year's record of 419 ppm.
We break peak CO2 records every year because we emit CO2 into the atmosphere faster than it can be naturally cycled out by our carbon sinks (ocean, plants, etc.). CO2 emissions primarily come from fossil fuel combustion for energy, transport, and industrial processes. This heat-trapping gas (otherwise known as a greenhouse gas) can remain in the atmosphere for hundreds to thousands of years, which is why it has such a powerful influence on the long-term warming trend.
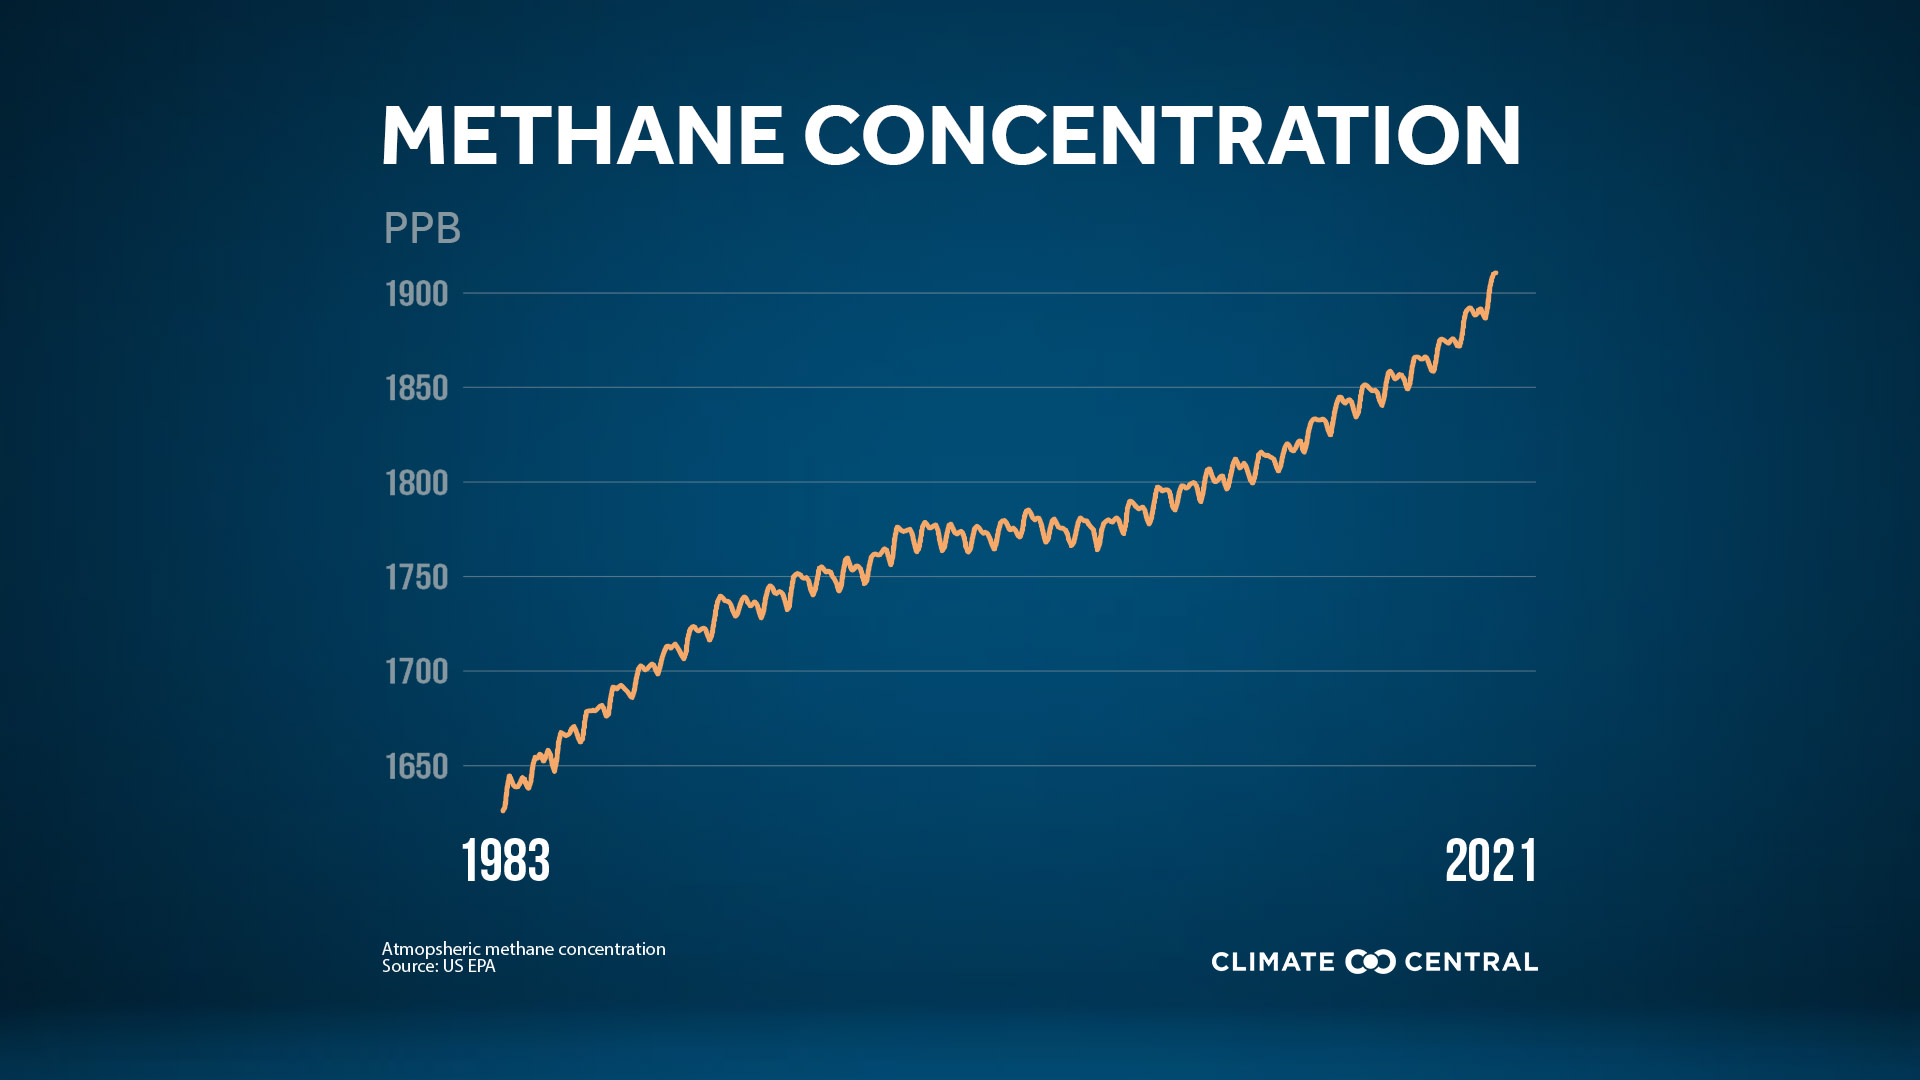
Methane and other greenhouse gases are on the rise, too.
CO2 is not the only greenhouse gas breaking records. Atmospheric methane concentrations had their largest annual increase in 2021 since records started in 1983. Methane concentrations reached almost 1900 parts per billion (ppb) in 2021, 17 ppb higher than last year and 162% higher than pre-industrial methane levels.
In the U.S., methane emissions primarily come from the production of oil, natural gas, and coal, animal agriculture (particularly cow “burps”), and landfills. And although it is a short-lived greenhouse gas compared to CO2 (12 years versus centuries for CO2), it is highly effective at trapping heat. Over a 20-year period, methane traps heat 81 times more effectively than CO2—making it one of the key gases to reduce to limit future warming. More than 100 countries have already pledged to significantly reduce methane emissions by 2030.
The remaining major greenhouse gases, nitrous oxide and fluorinated gases, are also increasing–albeit at varying rates and lower concentrations than methane and carbon dioxide.
Where are greenhouse gas emissions coming from?
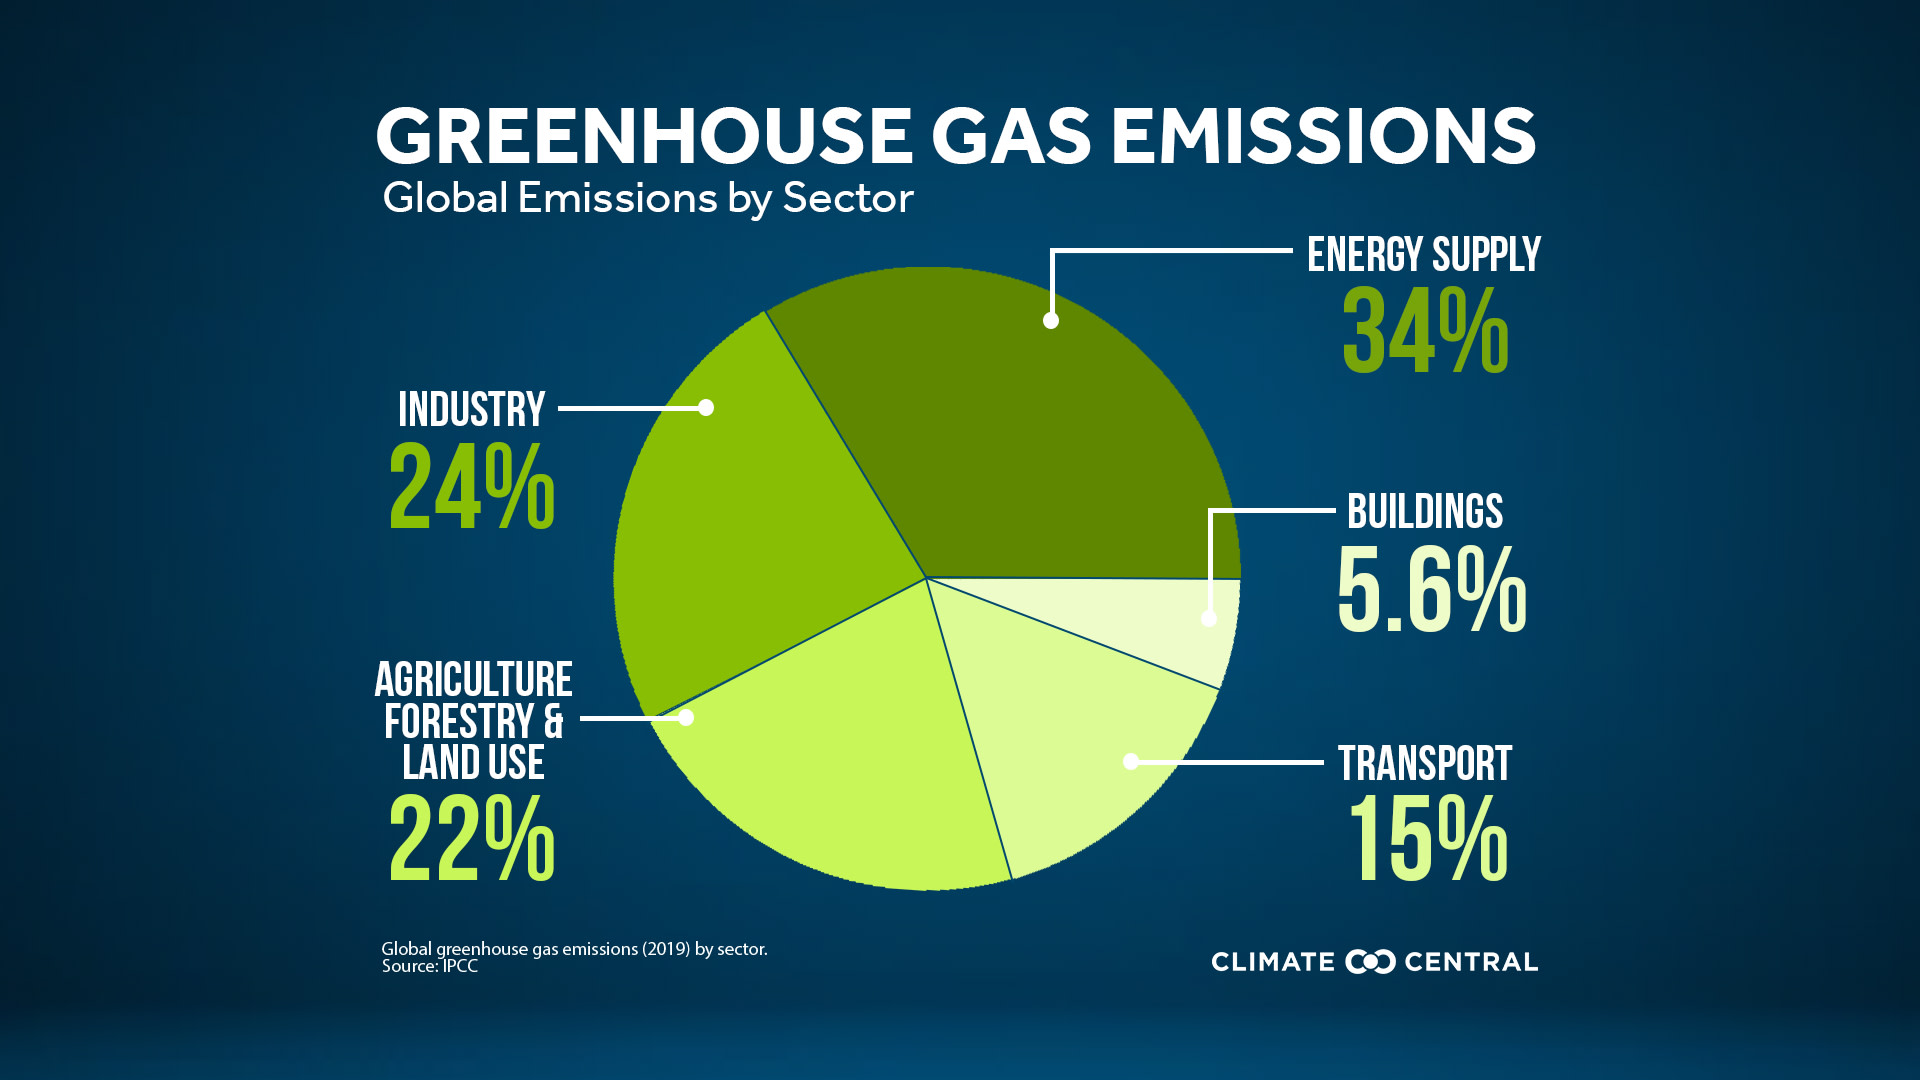
The continued rise of global greenhouse gas emissions is mainly from human activities (including fossil fuel combustion, industrial processes, and land use) in these five sectors:
Energy/Electricity sector: production, transmission, and distribution of energy and electricity to power our homes and economy
Industry sector: production and manufacturing of products and raw materials
Agriculture sector: growing, maintaining, and harvesting our crops and livestock
Transportation sector: modes of public and private transport like cars, trucks, and airplanes
Buildings/Commercial and Residential sector: powering, heating, cooling, and other activities related to commercial buildings and homes
Some sectors emit more than others. In the U.S., the transportation sector contributed the most greenhouse gas emission (27%) in 2020, followed by electricity (25%), industry (24%), commercial & residential (13%), and agriculture (11%). Globally (using 2019 data), the energy sector produced the most greenhouse gas emissions (34%), followed by industry (24%), agriculture (22%), transport (15%), and buildings (5.6%).
How do we cut greenhouse gas emissions?
As reconfirmed in the recent IPCC Working Group III report, we need “rapid and deep” emission cuts across all sectors if we want a chance at limiting future warming to 1.5°C or below 2°C. Every ton of CO2 we emit today will take centuries to naturally cycle out of the atmosphere. Every year that passes we get closer to exceeding the emissions budget we set as a global community. If we want a world with the least amount of climate change impacts, we have to take action within this decade.
A lot is riding on these next couple of years. As overwhelming as it is, there is good news—the solutions we need already exist. We know where emissions come from, and we know how to bring them down to zero. For instance, transportation is the largest contributor of greenhouse gas emissions in the U.S., but solutions like scaling the use of electric vehicles, and encouraging walking and biking can significantly cut these emissions. In addition, low-carbon, low-cost renewables like wind and solar energy have been around for a while and can significantly transform the energy sector—we just need to scale these solutions nationwide.
POTENTIAL LOCAL STORY ANGLES
What are some solutions to reduce greenhouse gas emissions?
Climate Central released a solutions series last year focused on electric vehicles, wind and solar energy, and climate-friendly homes. For more solutions, you can browse through the list on Project Drawdown or read solutions-focused stories on Solutions Journalism’s Solutions Story Tracker.
What are emissions like in my area?
The EPA has a great tool called the Greenhouse Gas Inventory Data Explorer that allows you to select by sector, greenhouse gas, year, and state. You can also find raw emissions data for your state on the U.S. Energy Information Administration (EIA) website.
LOCAL EXPERTS
The SciLine service, 500 Women Scientists or the press offices of local universities may be able to connect you with local scientists who have expertise on emissions and climate change. The American Association of State Climatologists is a professional scientific organization composed of all state climatologists.
NATIONAL EXPERTS
Ralph Keeling, Ph.D.,
Director, Scripps CO2 Program
Contact: rkeeling@ucsd.edu
Topics: Keeling Curve, recent perturbations to the global carbon cyclePieter Tans, Ph.D.
Senior Scientist, Global Monitoring Laboratory
NOAA Global Greenhouse Gas Reference Network
Contact: Pieter.Tans@noaa.gov
Topics: greenhouse gasesDrew Shindell, Ph.D.,
Nicholas Professor of Earth Sciences, Duke University
Speacial Representaive on Methane Action,
Climate & Clean Air Coalition/United Nations Environment Programme
Contact: drew.shindell@duke.edu
Topics: methane
METHODOLOGY
Methane Concentration and Temperature & Carbon Dioxide: Methane data and CO2 data reported by NOAA’s Earth System Research Laboratory Global Monitoring Division
U.S. Emissions by Sector: Source percentages (2020 data) as reported by the Environmental Protection Agency’s Inventory of U.S. Greenhouse Gas Emissions and Sinks
Global Emissions by Sector: Source percentages (2019 data) as reported by Working Group III of the Sixth Assessment Report of the Intergovernmental Panel on Climate Change