Climate Matters•January 30, 2019
Not-So-Extreme Cold
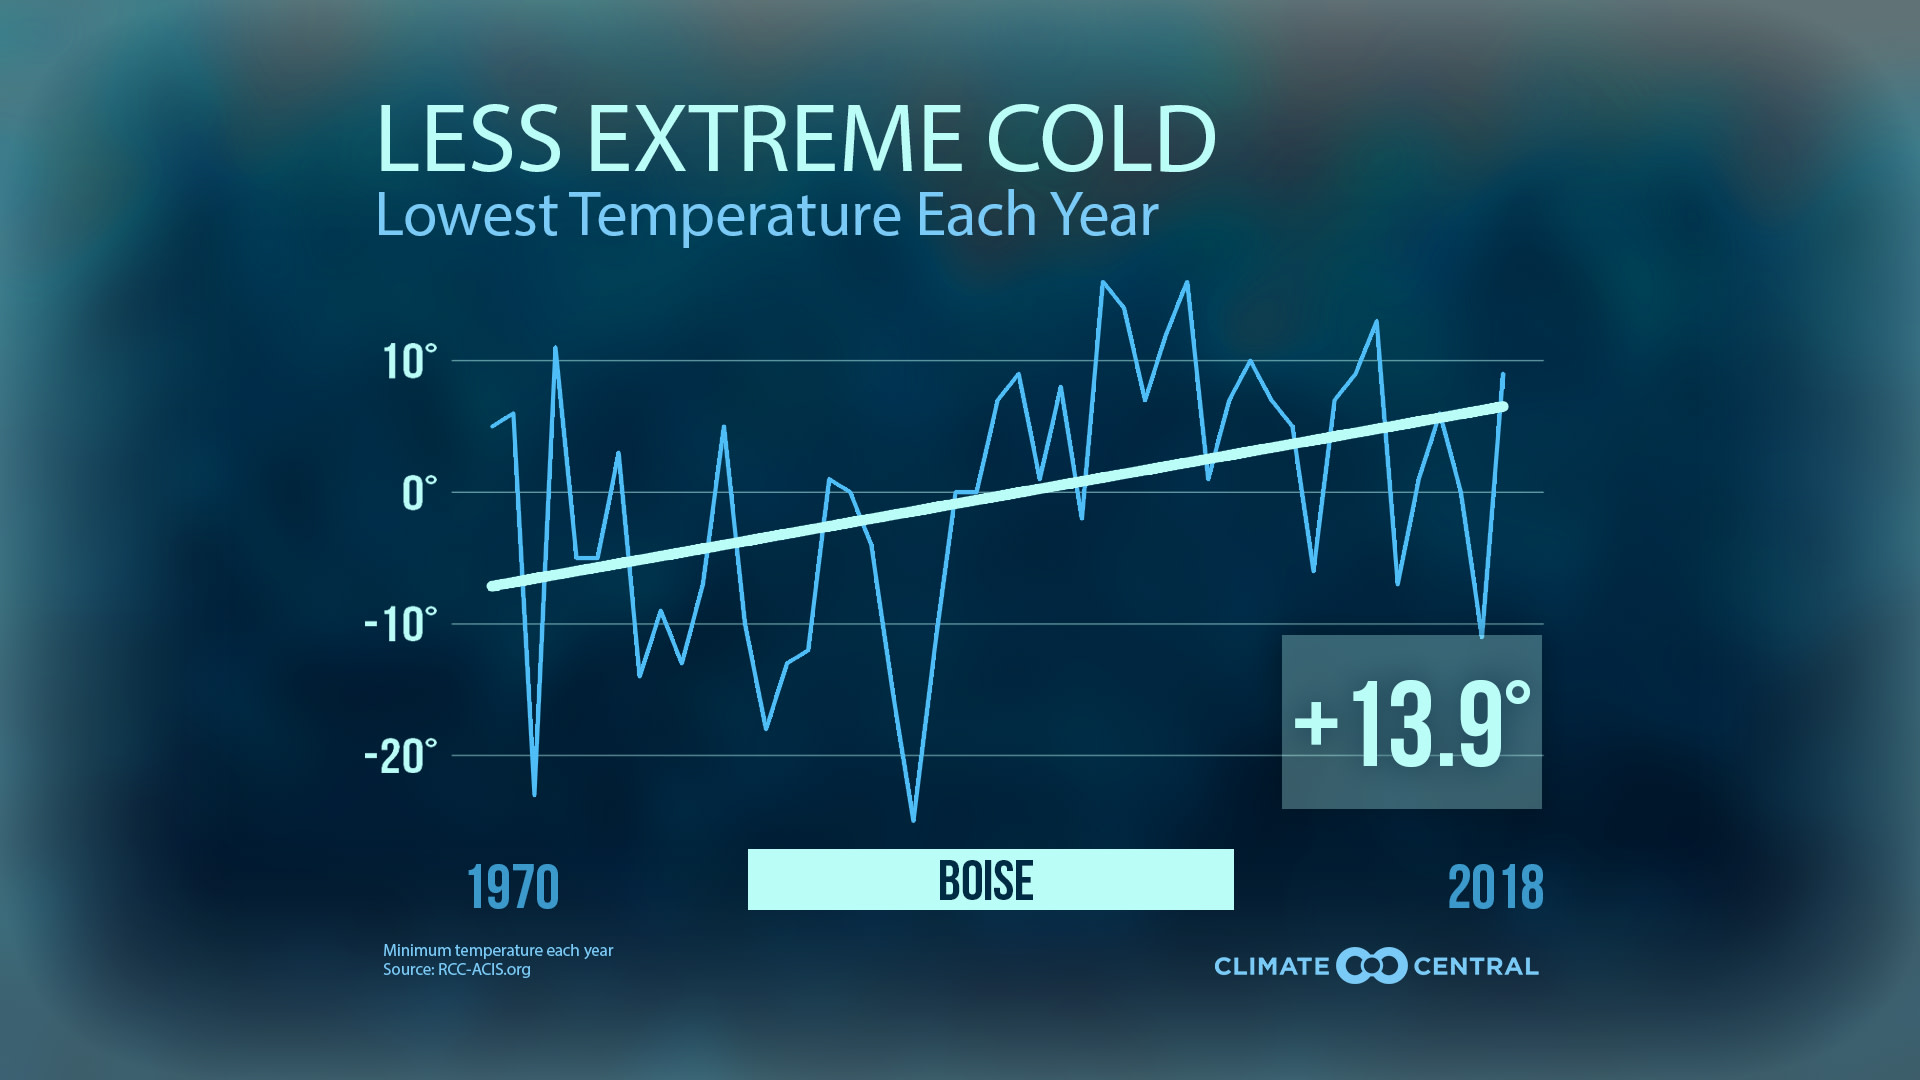
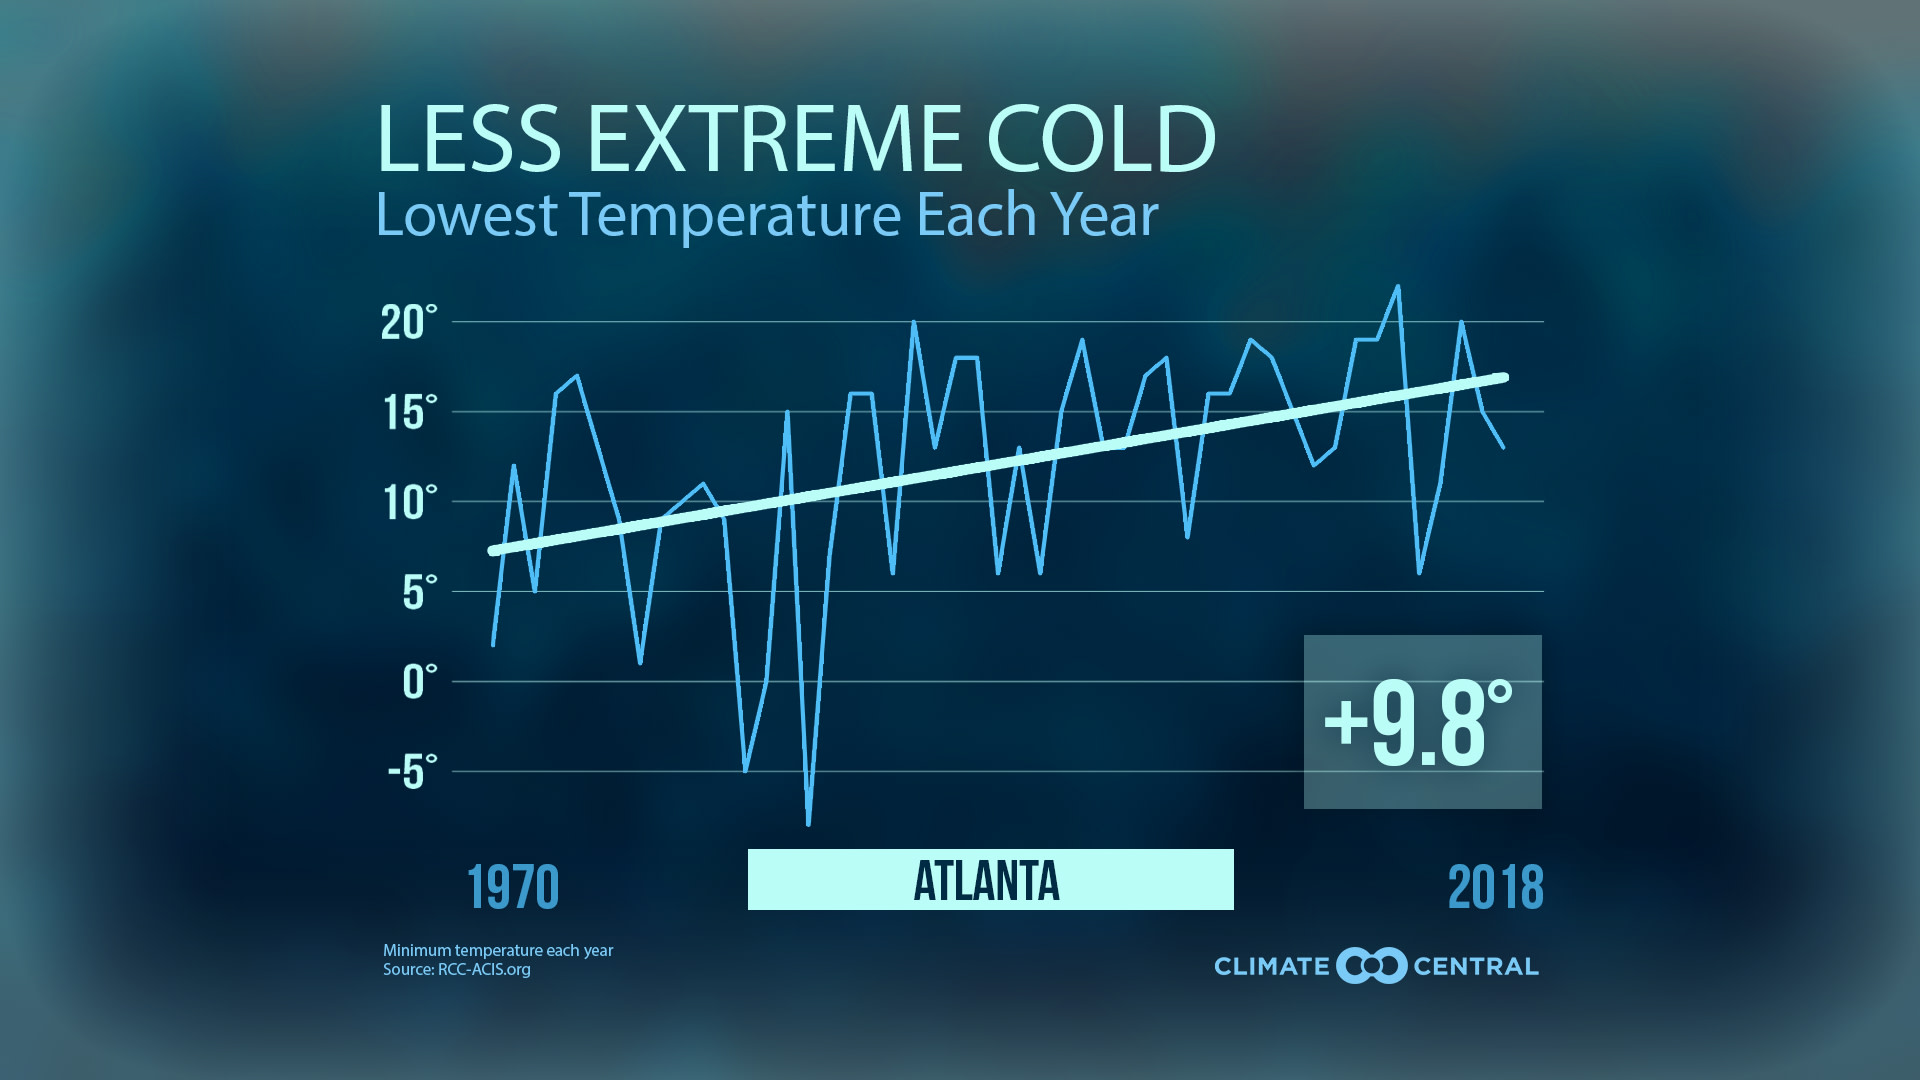
With a polar outbreak plunging down through the Great Lakes, some cities may be dropping to their coldest temperatures in decades. But how do this week’s extremes compare to the long-term trend? As our greenhouse gas emissions continue to drive climate change, cold extremes are trending warmer across the country.
In the last half-century, 96 percent of our 244 locations have recorded a rise of at least 1°F in their yearly coldest temperature, while only 2 percent have seen a decrease of at least 1°F. The average trend across these cities is a 6°F rise, and 33 cities in 20 states have recorded an increase of 10°F or more. The top five warming trends include Boise, Idaho; Las Vegas, Nevada; Albany, New York; Butte, Montana, and Minneapolis, Minnesota.
We can also track the imprint of climate change by comparing the ratio of record highs to record lows. In a stable climate, we would still experience extreme cold and extreme heat, but those extremes would balance out over time. However, with human-caused climate change, record highs are clearly outpacing record lows. In the 2010s alone, there have been twice as many record highs as record lows — the largest imbalance since record-keeping began a century ago. This is not a seasonal trend; all 12 months have had more record highs than lows in the 2010s. And according to a 2016 study, the ratio of record highs to lows could increase to 15:1 with 3°C (5.4°F) of U.S. mean temperature warming — a threshold we may reach unless we rapidly reduce greenhouse gas emissions.
Less extreme cold may be a relief, but winter warming can make other seasons less tolerable. By feeding into the shoulder seasons of spring and fall, shorter winters can mean longer allergy seasons, more costly cooling degree days in the summer, and extended seasons for ticks and mosquitoes. Those pests wouldn’t survive this week’s chill, but such extreme chills won’t be coming very often.
Methodology: Annual minimum temperature trends from 1970 to 2018 were calculated using data from the Applied Climate Information System. Displayed trend lines are based on a mathematical linear regression. Meteorologist Guy Walton maintains a comprehensive records database, analyzing monthly, annual, and decadal records trends based on NCEI data. Records data are through the end of 2018.