Climate Matters•February 18, 2020
National and Global Emissions Sources (2020)

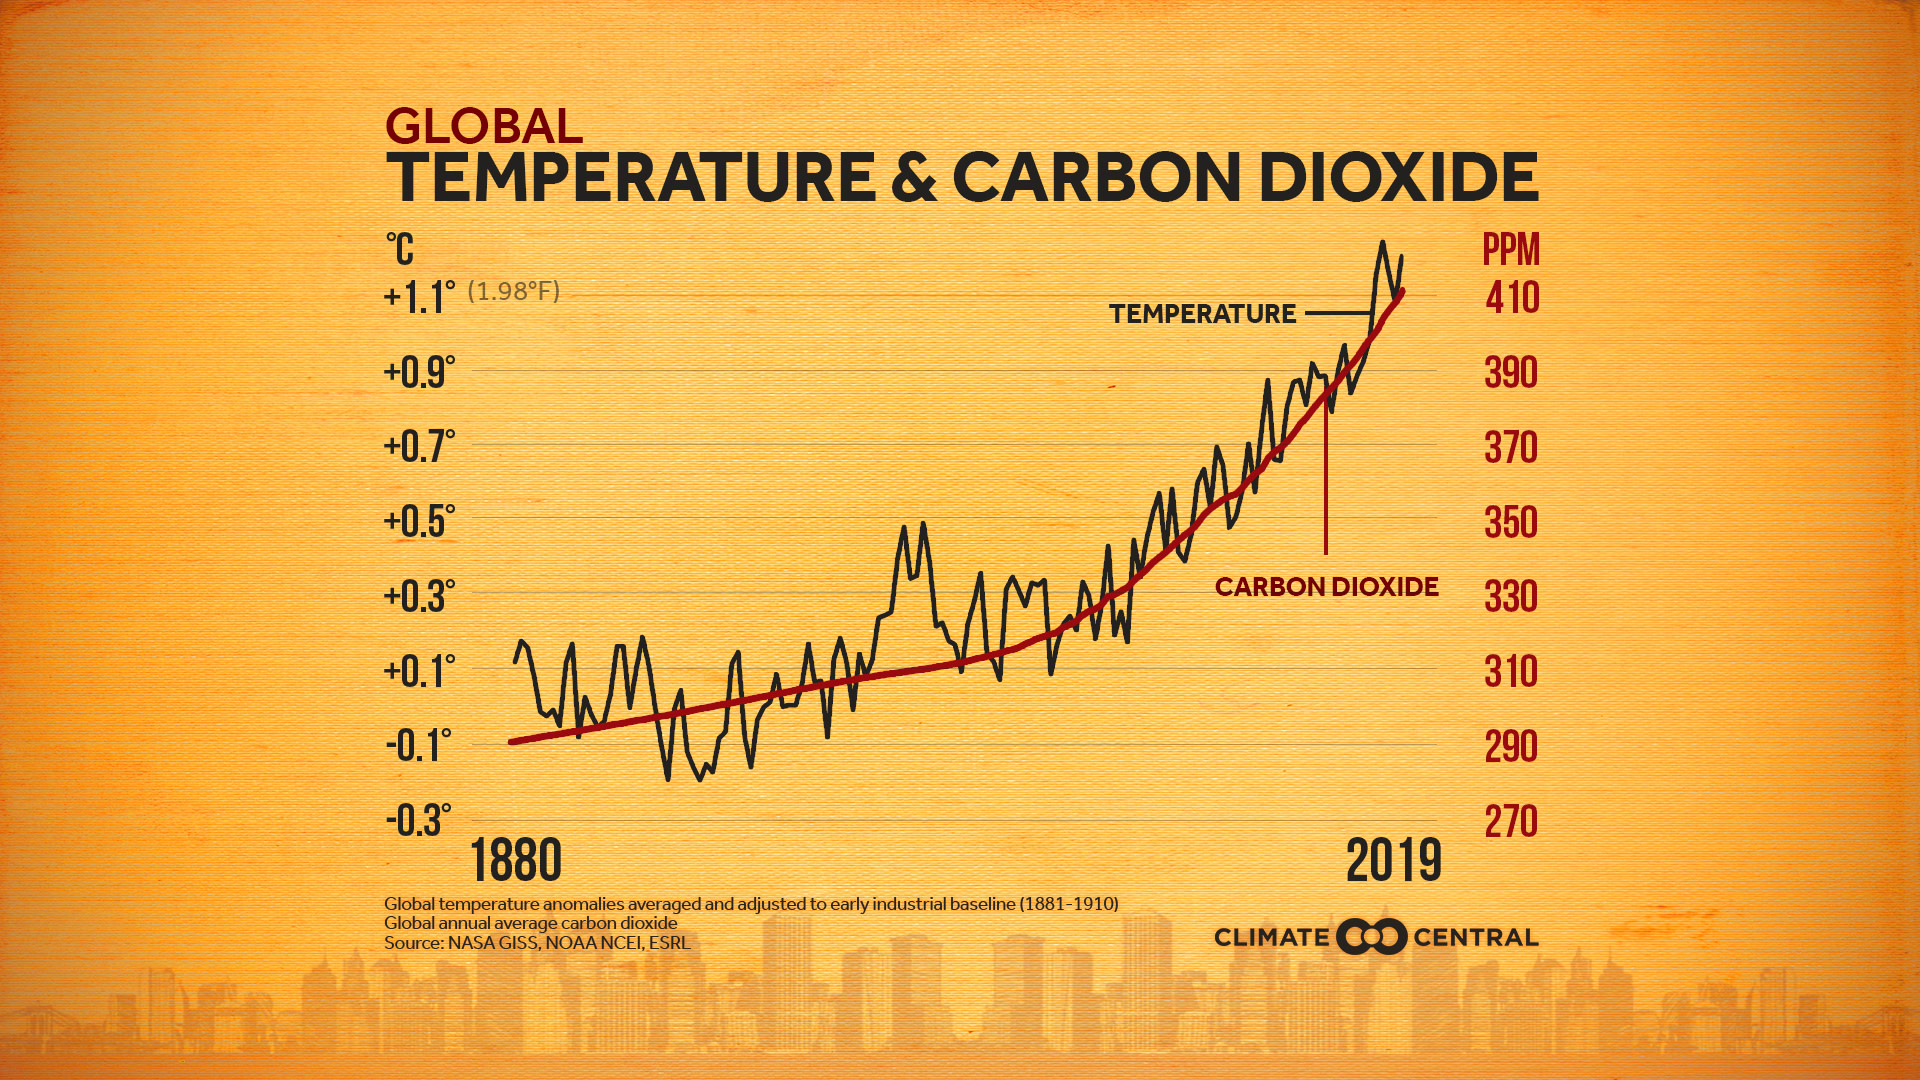
According to NOAA, January 2020 was the hottest January on record globally. This record is one data point in a global trend of warming—one that is directly related to human emissions of greenhouse gases. Stabilizing our climate will require substantially reducing our emissions - and understanding where they’re coming from is a key part of the process. This week we discuss the emissions sources in the United States.
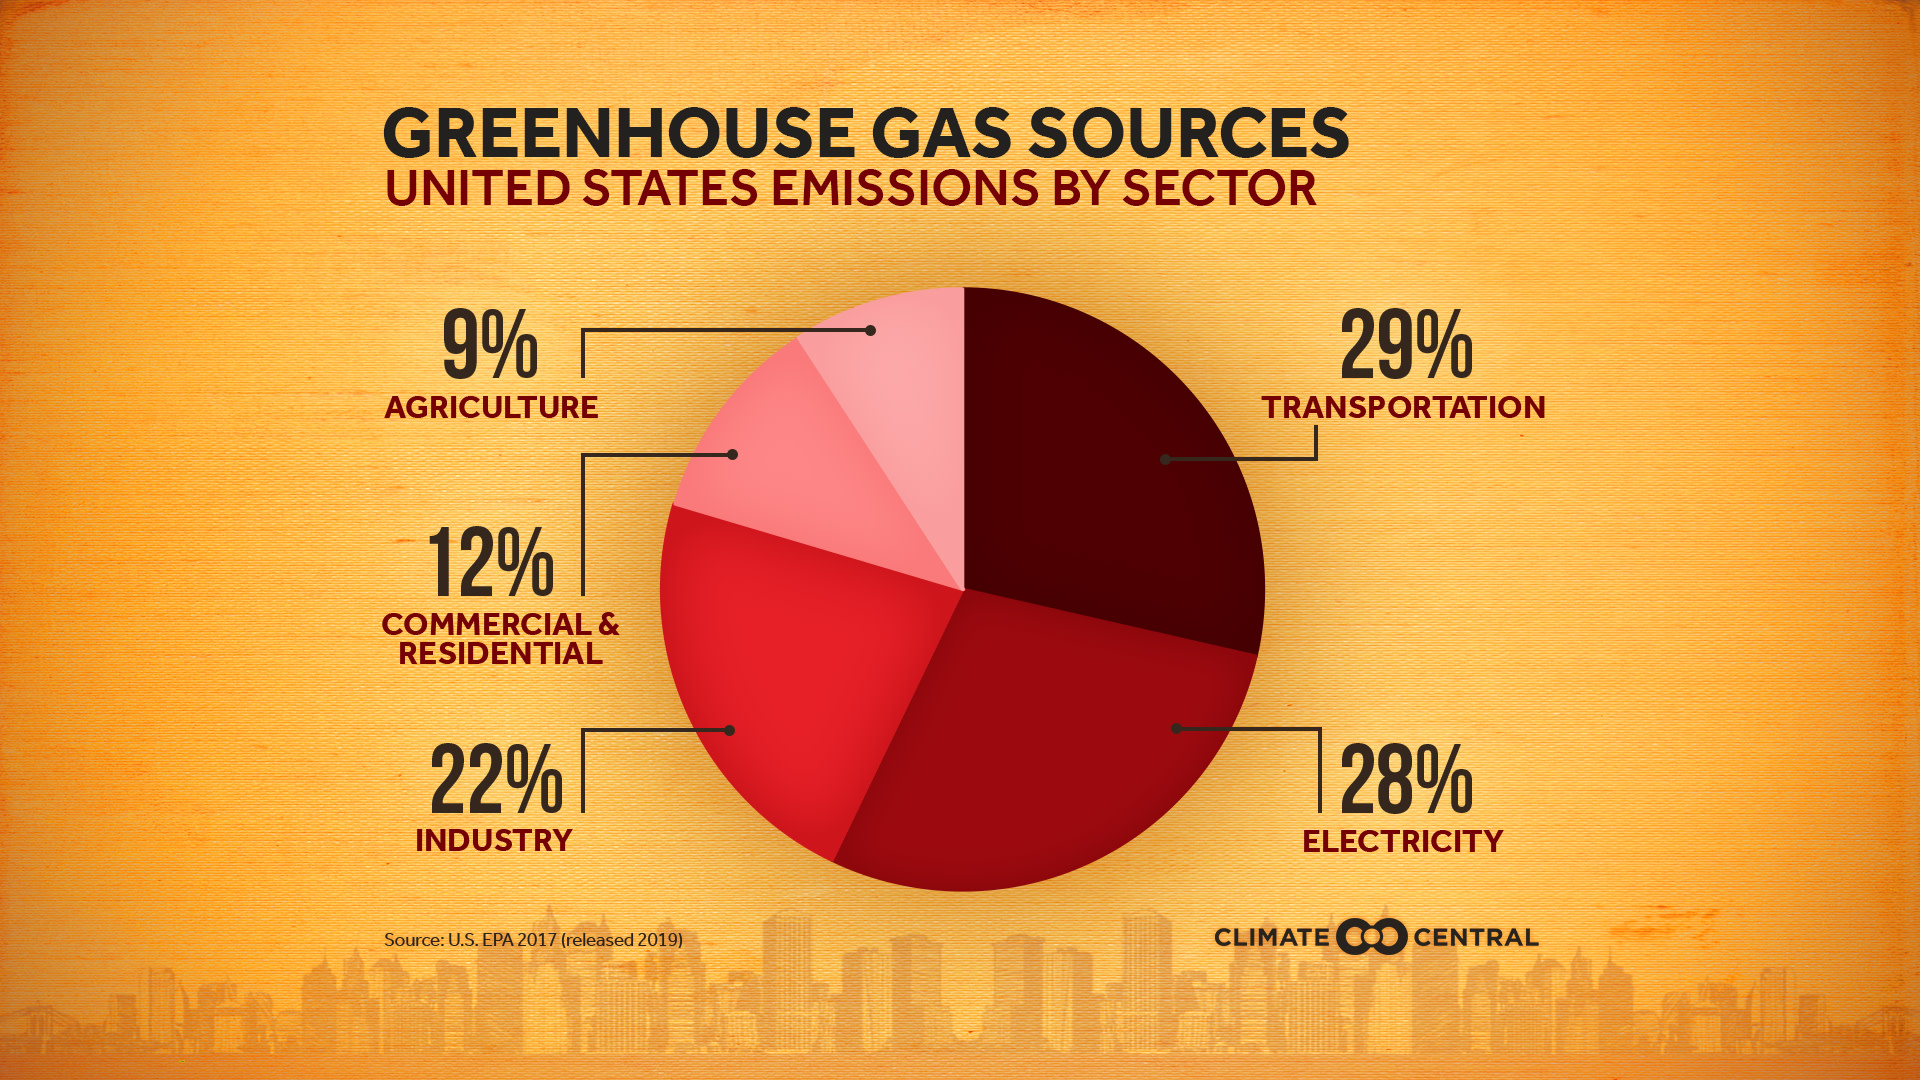
As defined by the Environmental Protection Agency (EPA), U.S. greenhouse gas emissions sources can be broken down into five sectors: transportation (29%), electricity (28%), industry (22%), commercial and residential (12%), and agriculture (9%).
Transportation is currently the largest source of greenhouse gas emissions in the U.S., having surpassed electricity generation in 2016. Emissions are produced through the burning of petroleum in the internal combustion engines of everything from cars and trucks to trains, planes and ships. Passenger cars and light-duty trucks account for more than half of the emissions from this sector.
Emissions from the electricity sector almost exclusively come from the combustion of fossil fuels to generate electricity. Although coal only accounted for 31% of energy generated in the U.S. in 2017, it was responsible for 68% of the emissions. Renewable energy sources—such as solar, wind, and hydroelectric—accounted for 16% of energy generation, while the remainder was generated by nuclear power and non-coal fossil fuels—natural gas and petroleum. This is a sector that is changing rapidly. According to a recent estimate, the share of electricity generated by renewables is currently expected to roughly double from 19% in 2019 to 38% in 2050.
At 22% of national emissions, the Industrial sector emits a significant share of the U.S. total. Industrial emissions are the result of producing commodities (such as steel and cement) through manufacturing, food processing, mining and construction. Maintaining buildings (by heating and cooling them, managing their waste, etc.) falls into the ‘Commercial and Residential’ sector, accounting for 12% of emissions. Finally, agriculture accounts for the remaining 9% of emissions, including through soil management practices as well as methane from livestock and manure.
Now at 414 ppm, atmospheric CO2 concentrations are higher than at any time in the past 800,000 years, which directly relates to the planet's temperature. The world has committed to keep warming well below 2℃ (3.6°F) globally, and that comes with the challenge of a carbon budget—a low-carb diet, if you will. Scientists estimate that humans can only emit 565 more gigatons of carbon dioxide and reasonably hope to meet the 2℃ target—a budget that would be exhausted in 15 years if emissions continue at the current rate of 36.6 gigatons of CO2 a year.
For more information on emissions and ways to reduce them:
Project Drawdown outlines ways that society can reduce emissions with current technologies and science. Since this space is advancing rapidly, keep an eye out for new updates from Project Drawdown.
The UN Environment Programme (UNEP) produces an annual Emissions Gap Report in the fall— outlining the gap between current global emissions and the cuts needed to meet global goals. Check out the latest interactive report to learn where emissions are, and where they need to be.
The Global Carbon Project presents a scientific picture of the global carbon cycle, which includes an annual update of the global carbon budget and trends.
The U.S. Energy Information Administration (EIA) provides regular reports on the latest domestic energy trends in electricity generation, prices and more.
Methodology: Calculations of average annual global temperature are performed independently at NASA and NOAA. Small differences in their calculations arise as NASA’s calculations are extrapolated to account for polar locations with poor station coverage, while NOAA relies more heavily on the polar station data. Climate Central compares temperatures to an earlier 1880-1910 baseline to assess warming during the industrial era.