Climate Matters•March 27, 2019
More Pollen Calling
As spring blooms, a less rosy trend comes in tandem — the pollen allergies that affect nearly 20 million Americans. The prevalence of allergies has skyrocketed in recent decades. In 1970, about 10 percent of Americans suffered from hay fever, which is caused by airborne allergens like pollen and mold spores; by 2000, 30 percent did. The rate of asthma — which often occurs alongside pollen allergies — nearly tripled between 1980 and 2010. Symptoms range from uncomfortable to dangerous, with asthma killing about 3,500 Americans in 2016. Allergies also affect our economy, costing the U.S. more than $18 billion each year. As the climate warms, the impacts of allergies are expected to rise as growing seasons get longer across the country.

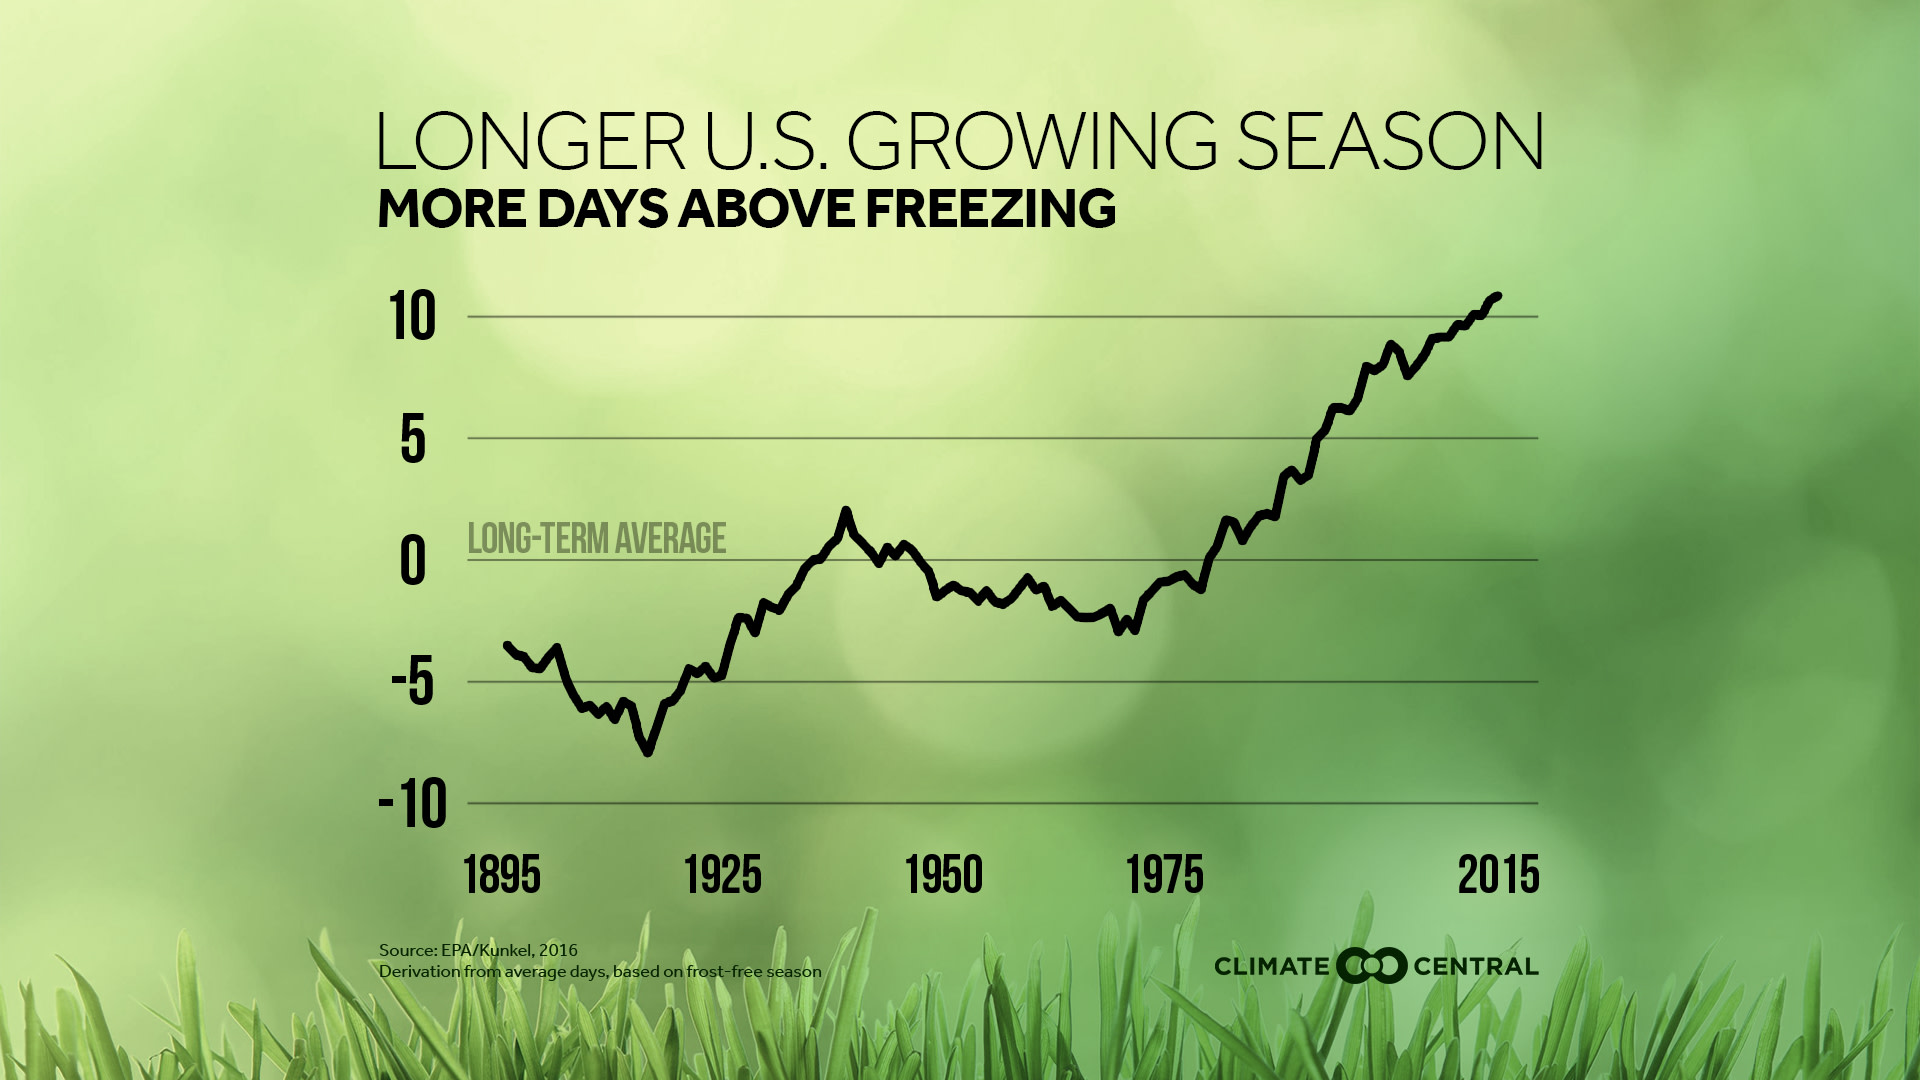
Climate Central tracked the time each year between the last winter freeze and first fall freeze — the period when plants grow, flower, and send out pollen. Over the last half-century, this season got longer in 83 percent of the 201 cities analyzed (43 of the regular 244 cities were excluded, largely due to a lack of consistent freezes). The season grew longer by two weeks on average across the U.S., and by at least four weeks in 34 cities. The largest changes occurred in the West, with increases of two months or more in Bend, Oregon; Medford, Oregon; and Las Cruces, New Mexico.

According to laboratory studies, CO2 emissions can also spur pollen production directly. At atmospheric CO2 concentrations of 600 parts per million — which we could hit around 2060 on our current trajectory — ragweed pollen production could double relative to 2000 CO2 levels. In those conditions, each grain of ragweed pollen could also get 1.7 times more allergically potent. The story is similar for the production of Timothy Grass pollen, a major allergen in the early summer. Our CO2 emissions may be invisible, but the resulting pollen levels will clearly be felt.
Methodology: The first and last day below 32 degrees were retrieved from the Applied Climate Information System. The length of the growing season is the number of days between these two points in time. Locations were only included in the analysis if they had a freeze season of at least 90 days.