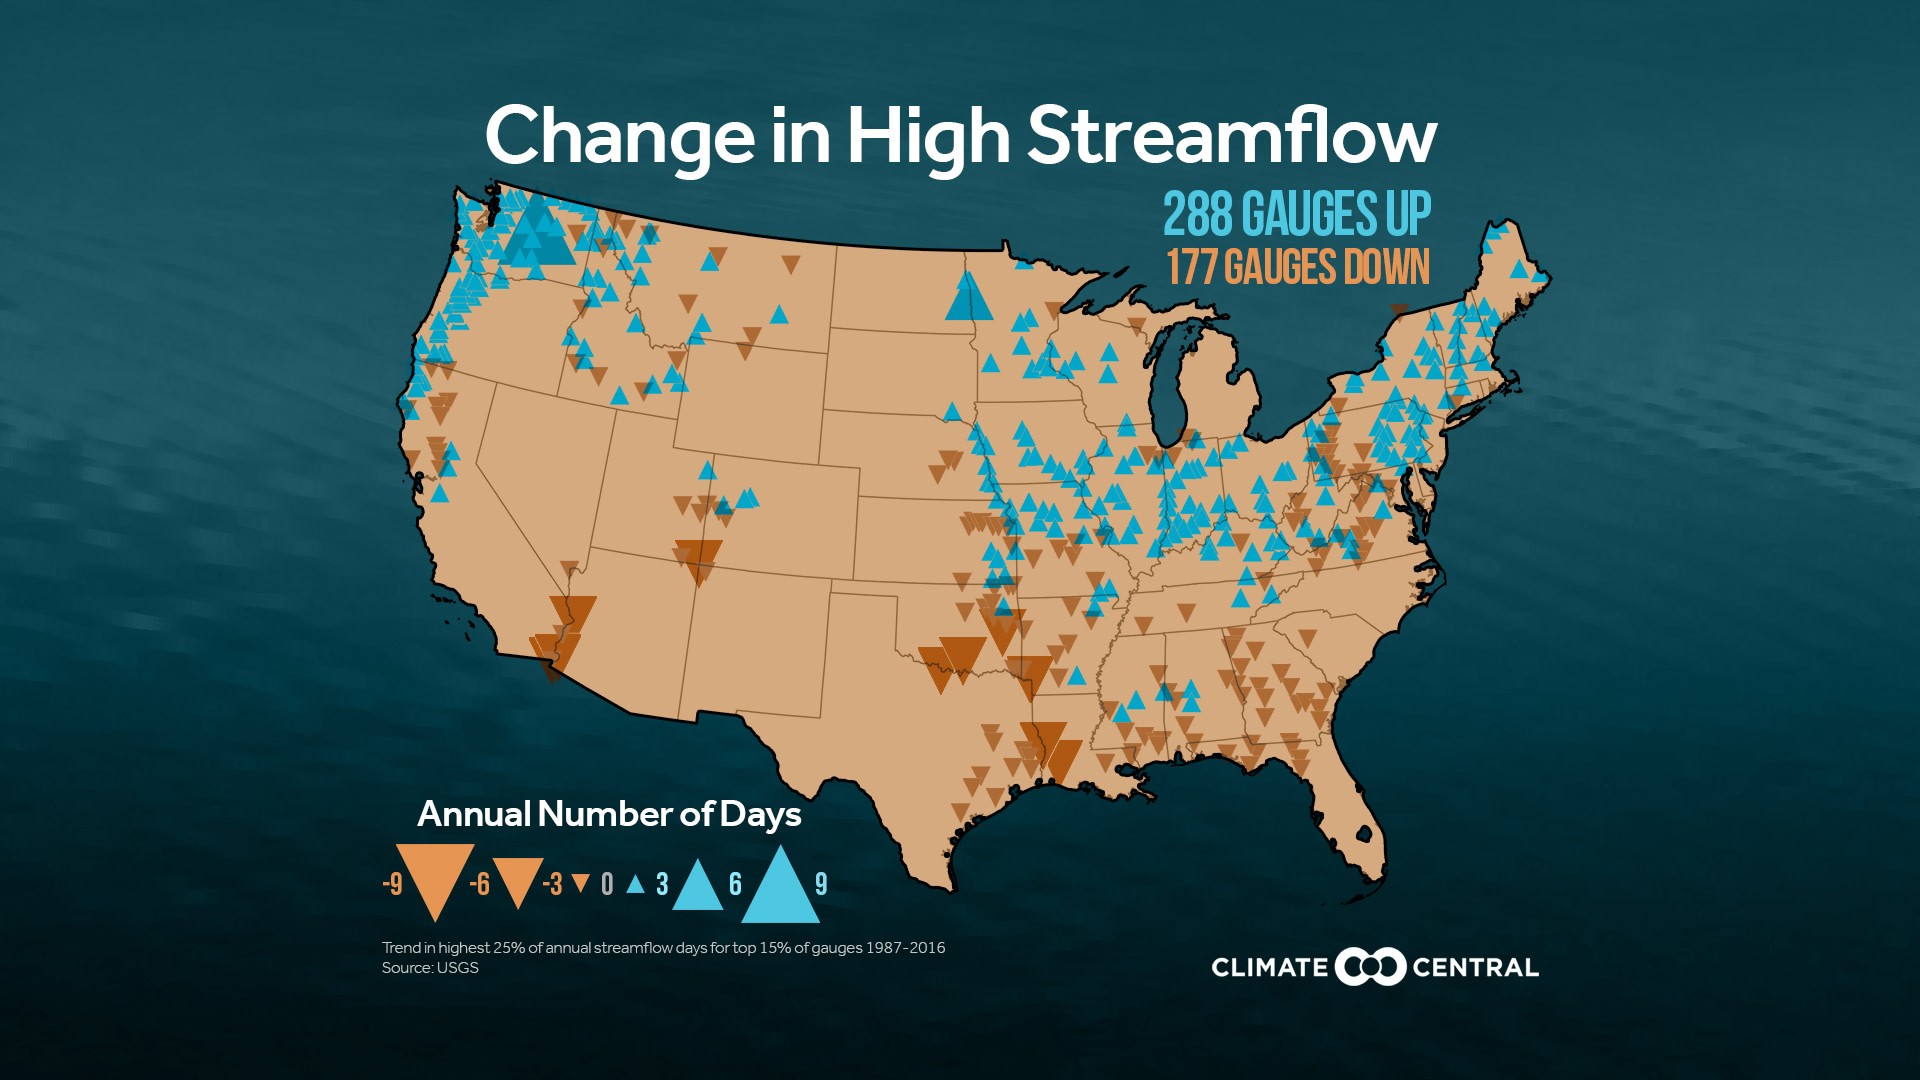
With the frequency of heavy precipitation increasing across most of the U.S., it follows that streamflow levels may be increasing as well. A Climate Central analysis of streamflow data at more than 2,100 active gauges found that the number of days with high stream flow (the top 25 percent of readings) has risen over the past 30 years in the largest rivers of the U.S., including the Ohio, Missouri, and Mississippi.
This streamflow analysis complements the National Climate Assessment and previous Climate Central analyses, which show that heavy precipitation is increasing in the Northeast and Midwest, consistent with what is expected in a warming world. Heavy precipitation is the key element driving streamflow, although urbanization and the reduction of permeable surfaces also play roles, as does the engineering of dams and levees.
The increasing number of days with high streamflow indicates that the risk for stream and river flooding is also on the rise. Additional data from the National Climate Assessment shows this is already happening, as the magnitude of flooding is increasing in the Mississippi Valley, Ohio Valley, and the Northeast.
With the recent flooding in the Mississippi Valley, we examined the streamflow data for additional seasonal trends. In addition to heavy rain, spring snow melt can also play a role in streamflow. During the spring, we found some of largest increases in high streamflow days in Upper Mississippi River Valley and the Northwest.
Daily discharge data from 1987-2016 was gathered from over 2,100 USGS stream gauges, representing the active gauges in the Federal Priority Streamgages program. Gauges missing more than 10% of daily observations were removed. High streamflow was defined as being in the top 25% of observations, or what the USGS defines as “above normal.”
To reflect the most active waterways, gauges that represented the highest 15 percent of average annual and average spring streamflow in the U.S. were displayed in the graphics above. Future analyses will determine where there may be additional seasonal trends in high stream flow.
