Climate Matters•August 3, 2017
Local Projections in Extreme Heat
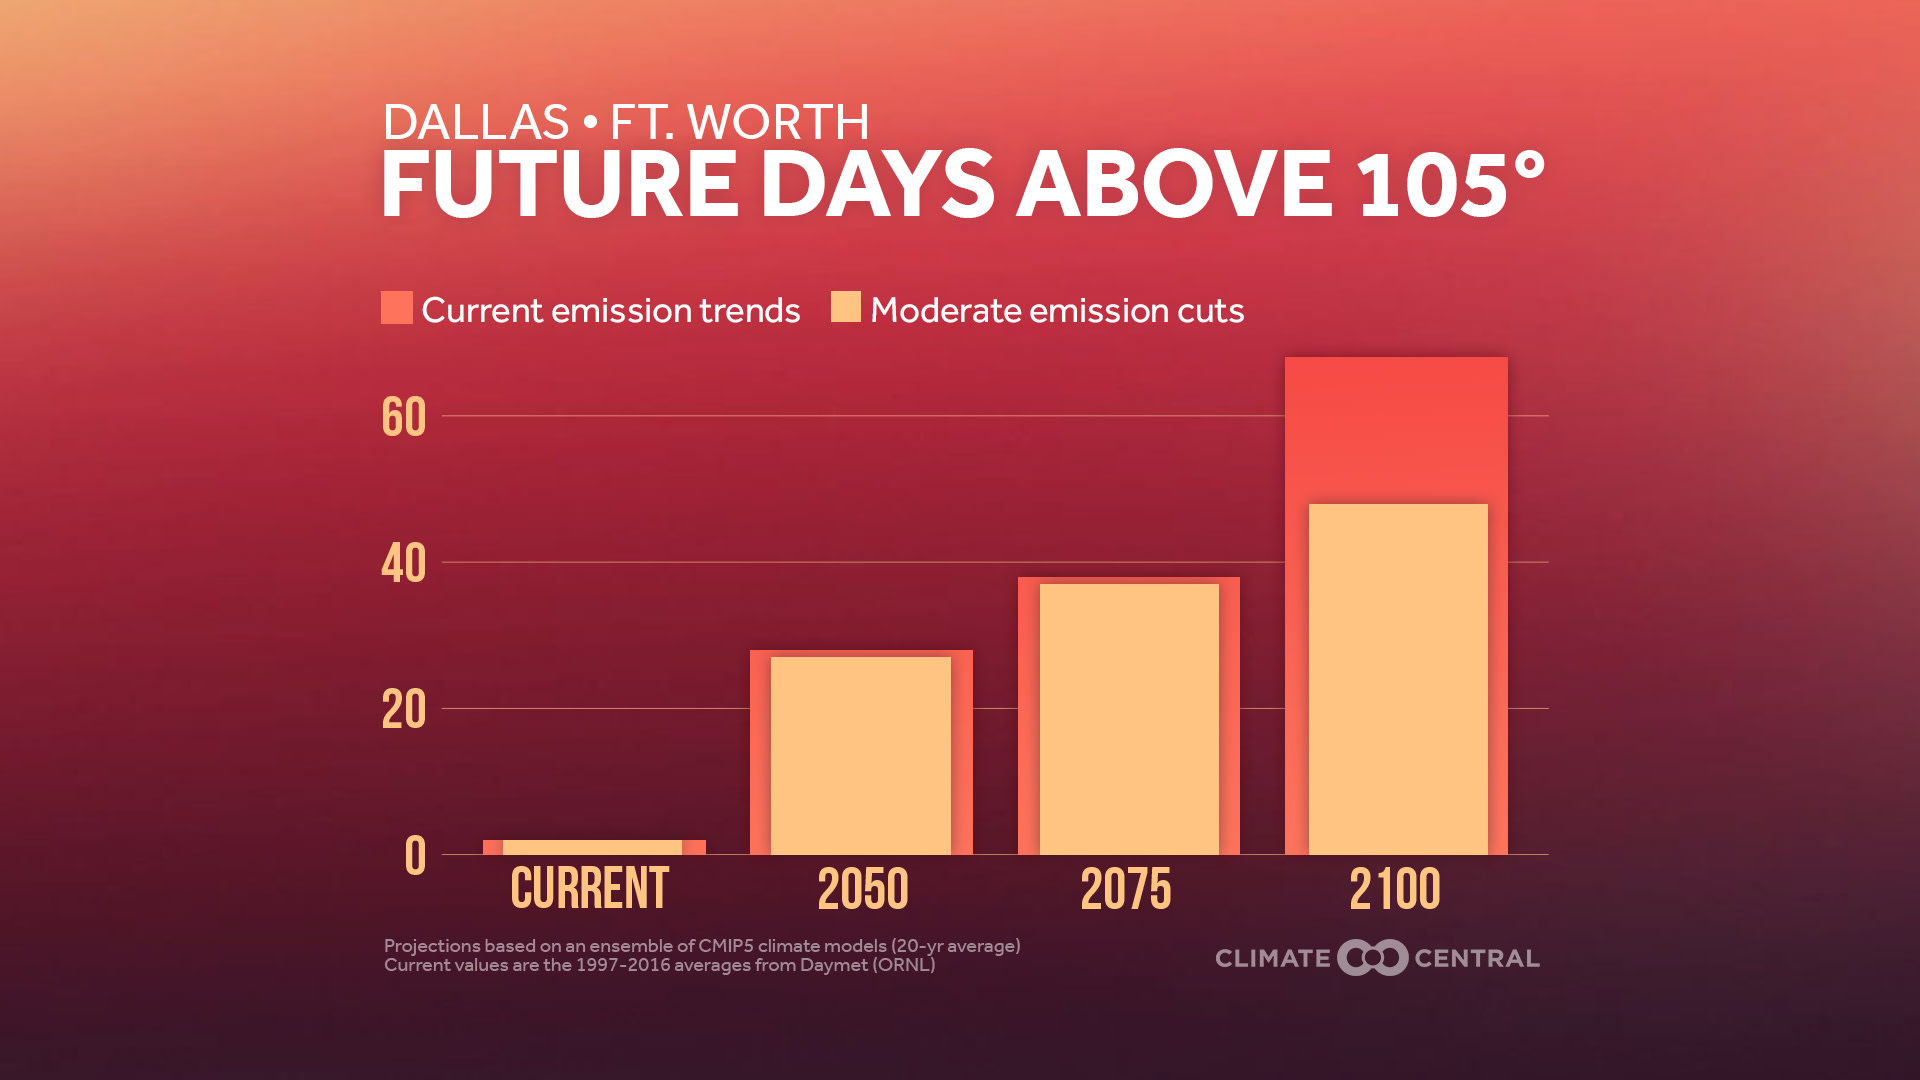
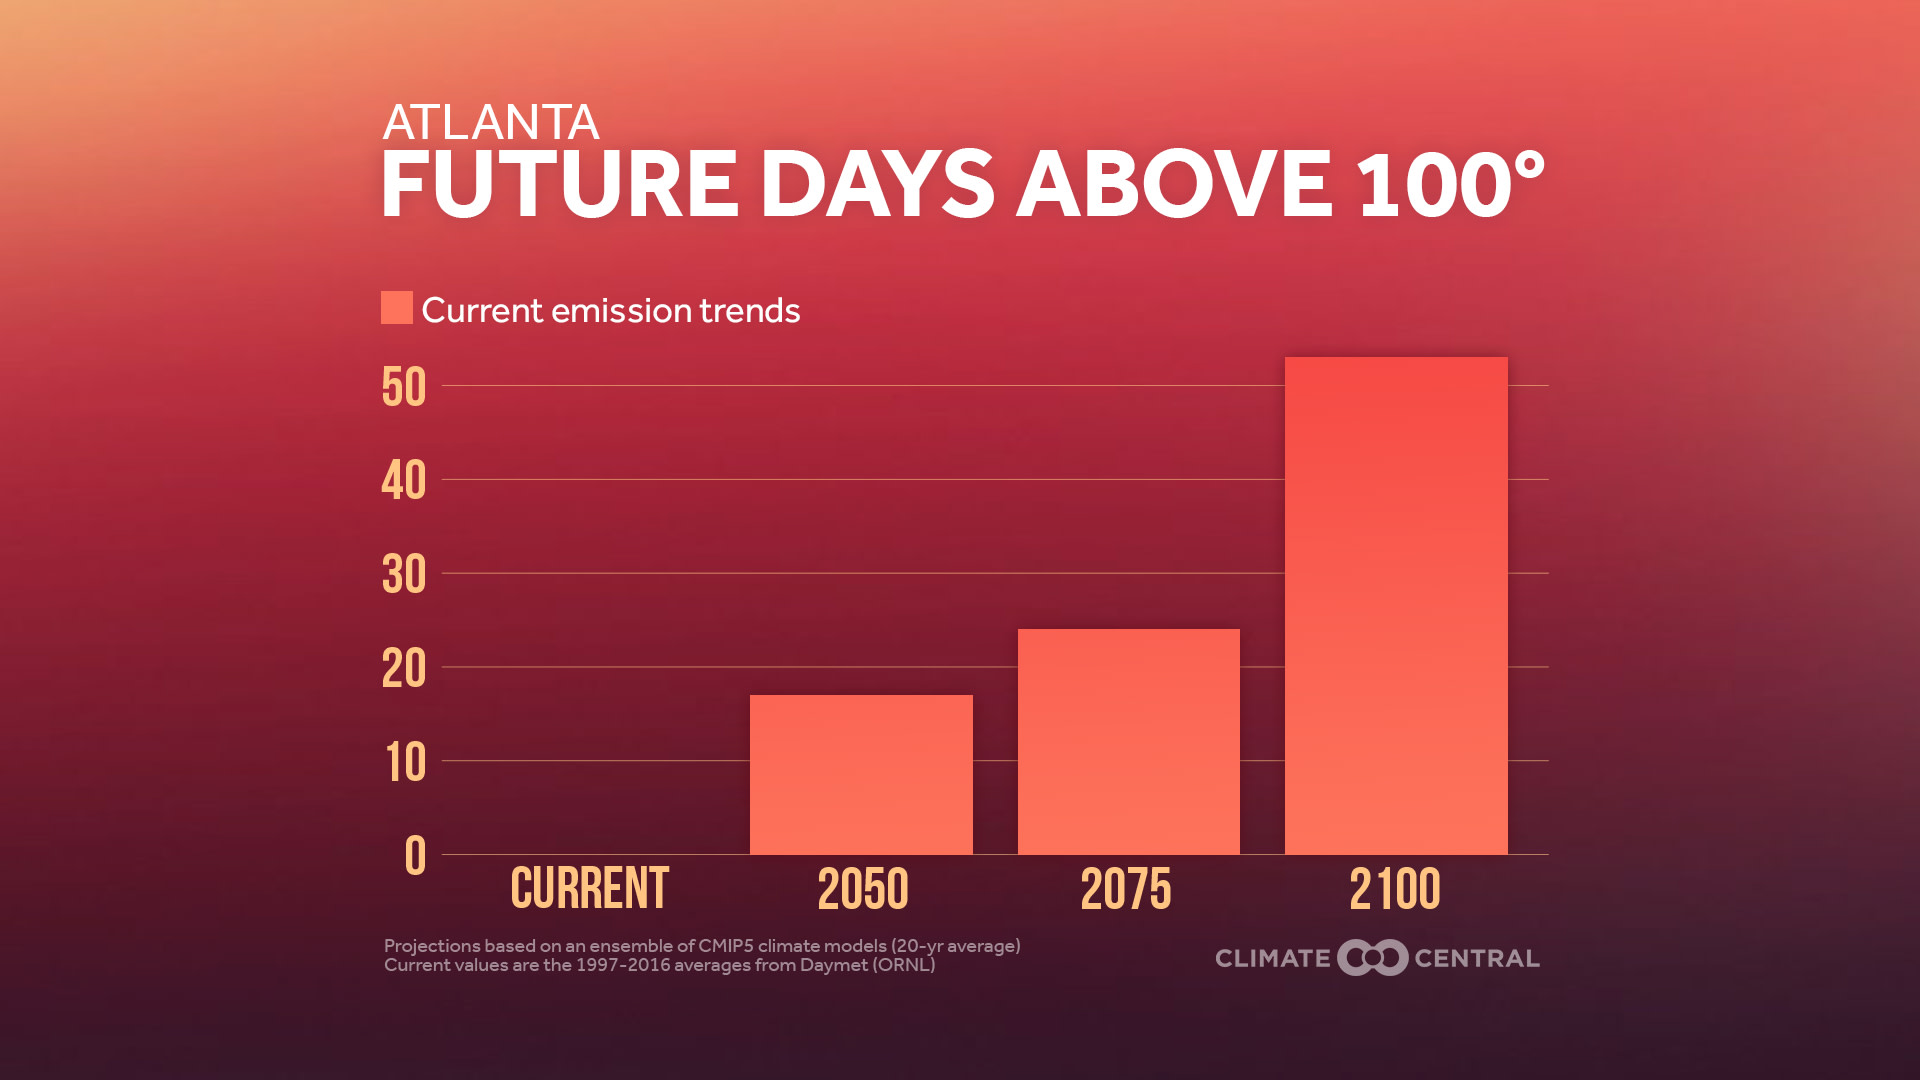

This week we look at how the frequency of extreme heat is projected to increase in our Climate Matters markets by the middle and the end of the century. The number of these very hot days is expected to increase sharply as the world further warms from the buildup of greenhouse gases. What may initially appear to be a small increase in the average temperature has a large impact on these extremes. As an entire distribution of daily high temperatures shifts slightly warmer, those rare days with extreme heat become much more numerous.
With the concentrations of greenhouse gases such as carbon dioxide continuing to climb, the frequency of extreme heat will likely increase. This will continue to be the case well into the future, as carbon dioxide stays in the atmosphere for centuries. Long-term trends caused by increasing greenhouse gases take time to settle in and are always intertwined with shorter-term weather variations. This is true in reality and in climate models. The magnitude of these variations depends on location and on the variable in question (extreme temperature is more variable than average temperature). So, for some locations, the details in the trends from different emissions scenarios can get masked in the short term by this noise, and that’s why you may see more hot days reflected in the mid-century “moderate emissions cuts” scenario versus the “no emissions cuts” one. But eventually, and everywhere, the warming climate change trends take over and become obvious.
More extreme heat will have serious consequences. Hotter days and warmer nights increase heat stress on the body and raise the risk of heat-related illnesses. Prolonged exposure to extreme heat can also affect transportation and infrastructure. Highways and railroads can buckle in extreme heat, and the lower air density that comes with extreme heat means aircraft must work harder to take off (something that’s already happening in places like Phoenix). Air conditioning demand would increase, stressing the electric power grid and raising cooling costs.
METHODOLOGY: Projections of the days each year above a threshold temperature are based on a downscaled and bias-corrected ensemble of climate models known as CMIP5 (the same models used in the IPCC). Each labeled year shows the average of the preceding 20 years. Data for 2016 are the annual averages of a gridded historical data set (Daymet, Oak Ridge National Lab) for 1997-2016.