By Climate Central
In the past six months, Florida has faced record high temperatures, abnormally toxic algal blooms, and the house-flattening winds of Hurricane Michael. California suffered its worst-ever wildfires, preceded by drought and followed by mudslides. Scientists may study climate change impacts separately, but their potential to strike together is clear.
Recent research highlights the past, present, and future of these compounding issues. A November 2018 paper in Nature Climate Change, led by Dr. Camilo Mora of the University of Hawaii-Manoa, has assessed how 11 climate hazards — from heat waves and floods to storms and wildfires — are piling up. A new Climate Central research brief, CLIMATE PILE-UP, translates their results to our 244 U.S. locations, finding that unchecked emissions could hit some areas with up to three severe, nearly simultaneous climate hazards by 2050.
These hazards are already happening. Of 890 climate impacts defined by Mora’s group, 467 have already occurred, according to the study’s review of nearly 3,300 scientific papers. A stand-alone website documents these events, from wildfire-induced health expenses to storm-related infrastructure damage.
To show how these dangers may pile up, Mora’s study scores each of the 11 hazards between -1 and 1 for a given year. A score of 1 represents the worst possible increase in a hazard’s intensity relative to 1955 levels. Negative scores mean decreased severity. Adding up the 11 numbers gives a cumulative score of severe hazards for that location and year
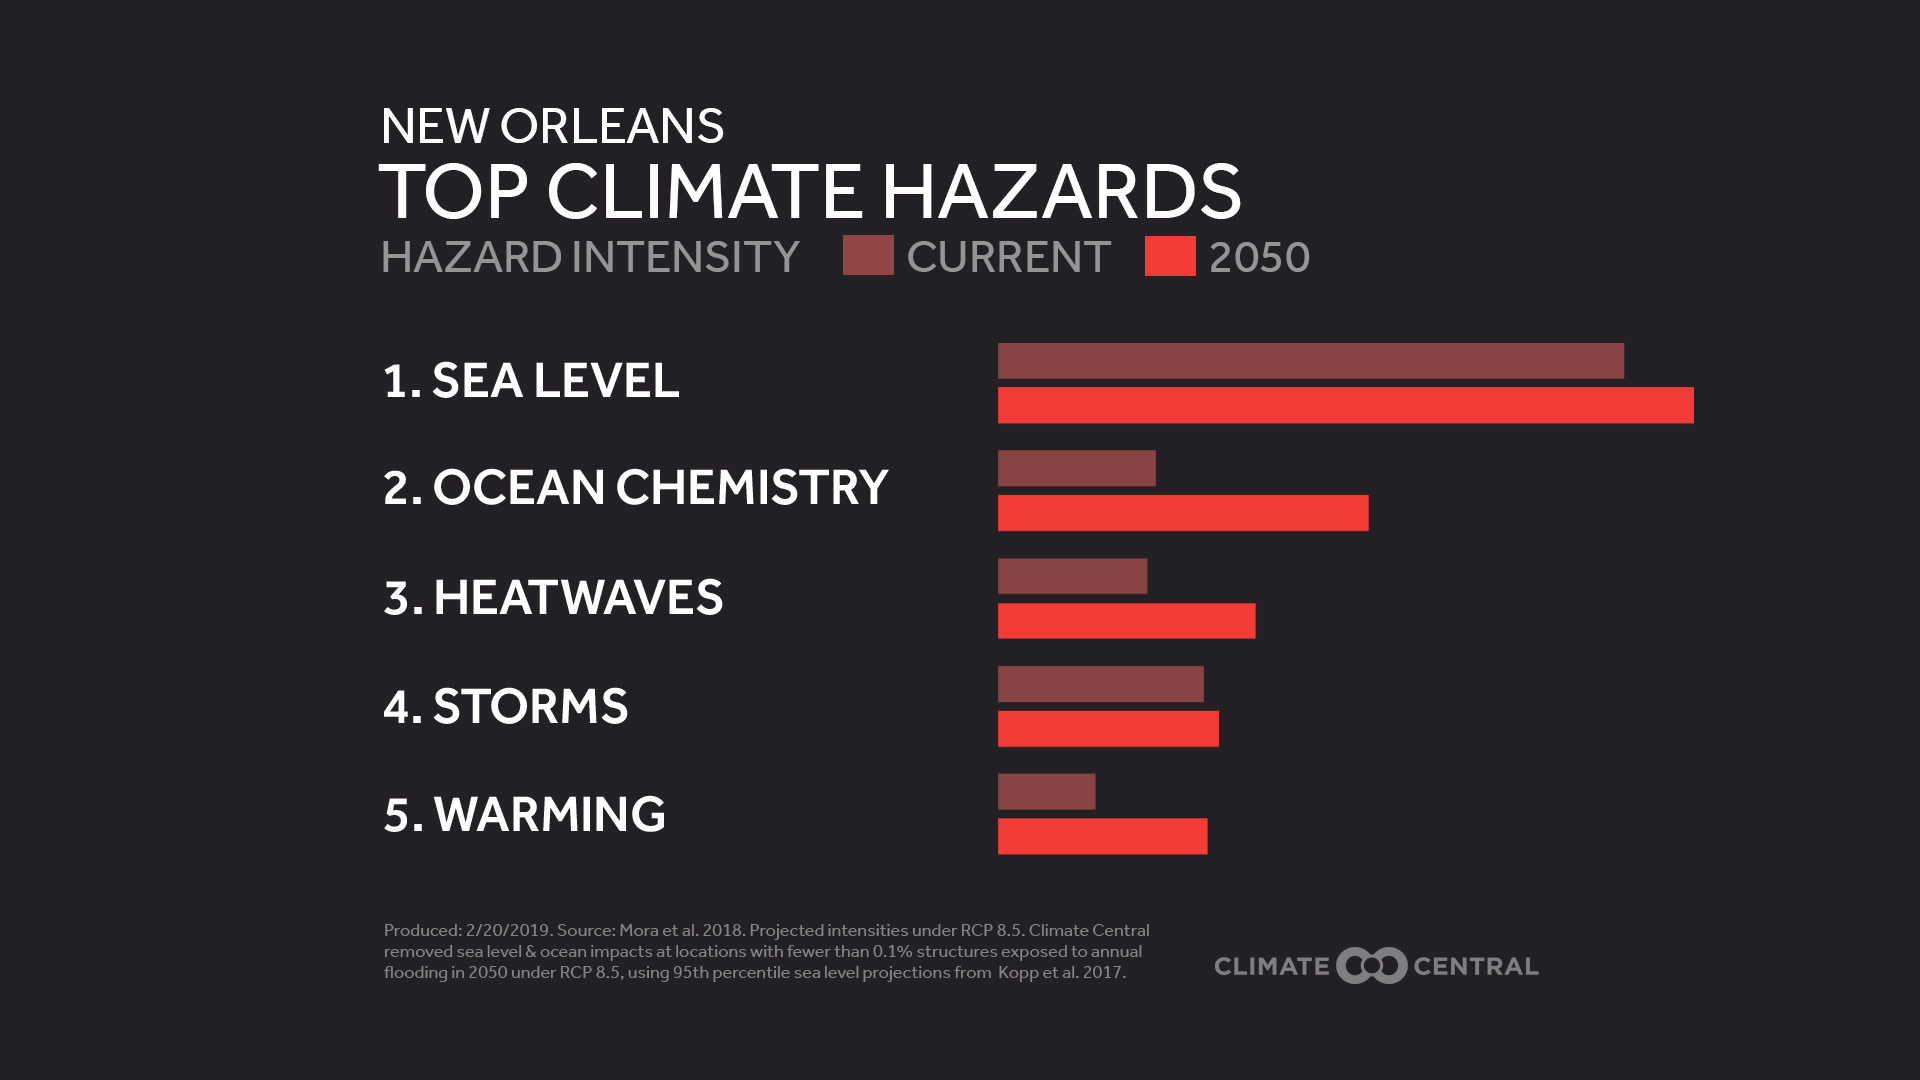
In a scenario of unchecked emissions, known as Representative Concentration Pathway (RCP) 8.5, the low-lying Gulf Coast will be hardest hit. New Orleans and Lafayette, Louisiana could see nearly three severe, nearly simultaneous climate hazards by 2050 — particularly from sea level rise, intense storms, and extreme heat. By 2050, 82 percent of cities could face at least one severe event in a given year. Specific hazards vary regionally, from extreme precipitation in the Northeast to drought and freshwater deficits in the Southwest and Plains.
Reducing our greenhouse gas emissions can lessen the impacts. If the above scenario is switched to one with moderate emissions cuts (RCP 4.5), the average city could see 0.5 fewer annual hazards in 2050. Deeper emissions cuts (RCP 2.6) could limit long-term damages even more, saving cities nearly two hazards in a given year by 2095. Immediate action is needed to curb these compounding climate dangers.
Read the full report, CLIMATE PILE-UP.
Methodology: Standardized index values for all hazards were extracted by members of the original research team for 244 weather stations based on their coordinates. The data cover 1955 to 2095 under three RCP scenarios (RCP 2.6, RCP 4.5, and RCP 8.5). Sea level and ocean chemistry variables were extrapolated to the nearest 1.5-degree coastal grid, which resulted in unexpected projections at some inland stations. Climate Central removed sea level and ocean impacts at locations with fewer than 0.1% structures exposed to annual flooding in 2050 under RCP 8.5, using 95th percentile sea level projections from the Kopp et al. 2017 model. Detailed information on the methodology can be found in Mora et al. 2018.
