Climate Matters•December 16, 2020
Holiday Stripes
KEY CONCEPTS
Climate Central in collaboration with climate scientist Ed Hawkins presents the global and Arctic warming stripes with a holiday twist—displaying temperature anomalies in a festive red and green.
The burning of fossil fuels increased the average global temperature over the years, and disproportionately increased temperatures across the Arctic, resulting in extremely low sea ice minimums and rapidly melting permafrost.
Climate Central would like to wish you a happy and safe holiday season!

Dear Santa,
Happy Holidays from your friends at Climate Central!
It’s been a while since we last wrote to you, but we have a very big wish this year. All we want for Christmas is to stabilize our climate! We know, we know—this is a big request that will take decades to achieve, but we have something that we hope will persuade you.
In the spirit of the upcoming holidays, Climate Central would like to share with you Ed Hawkins’ warming stripes—with a holiday-themed twist!
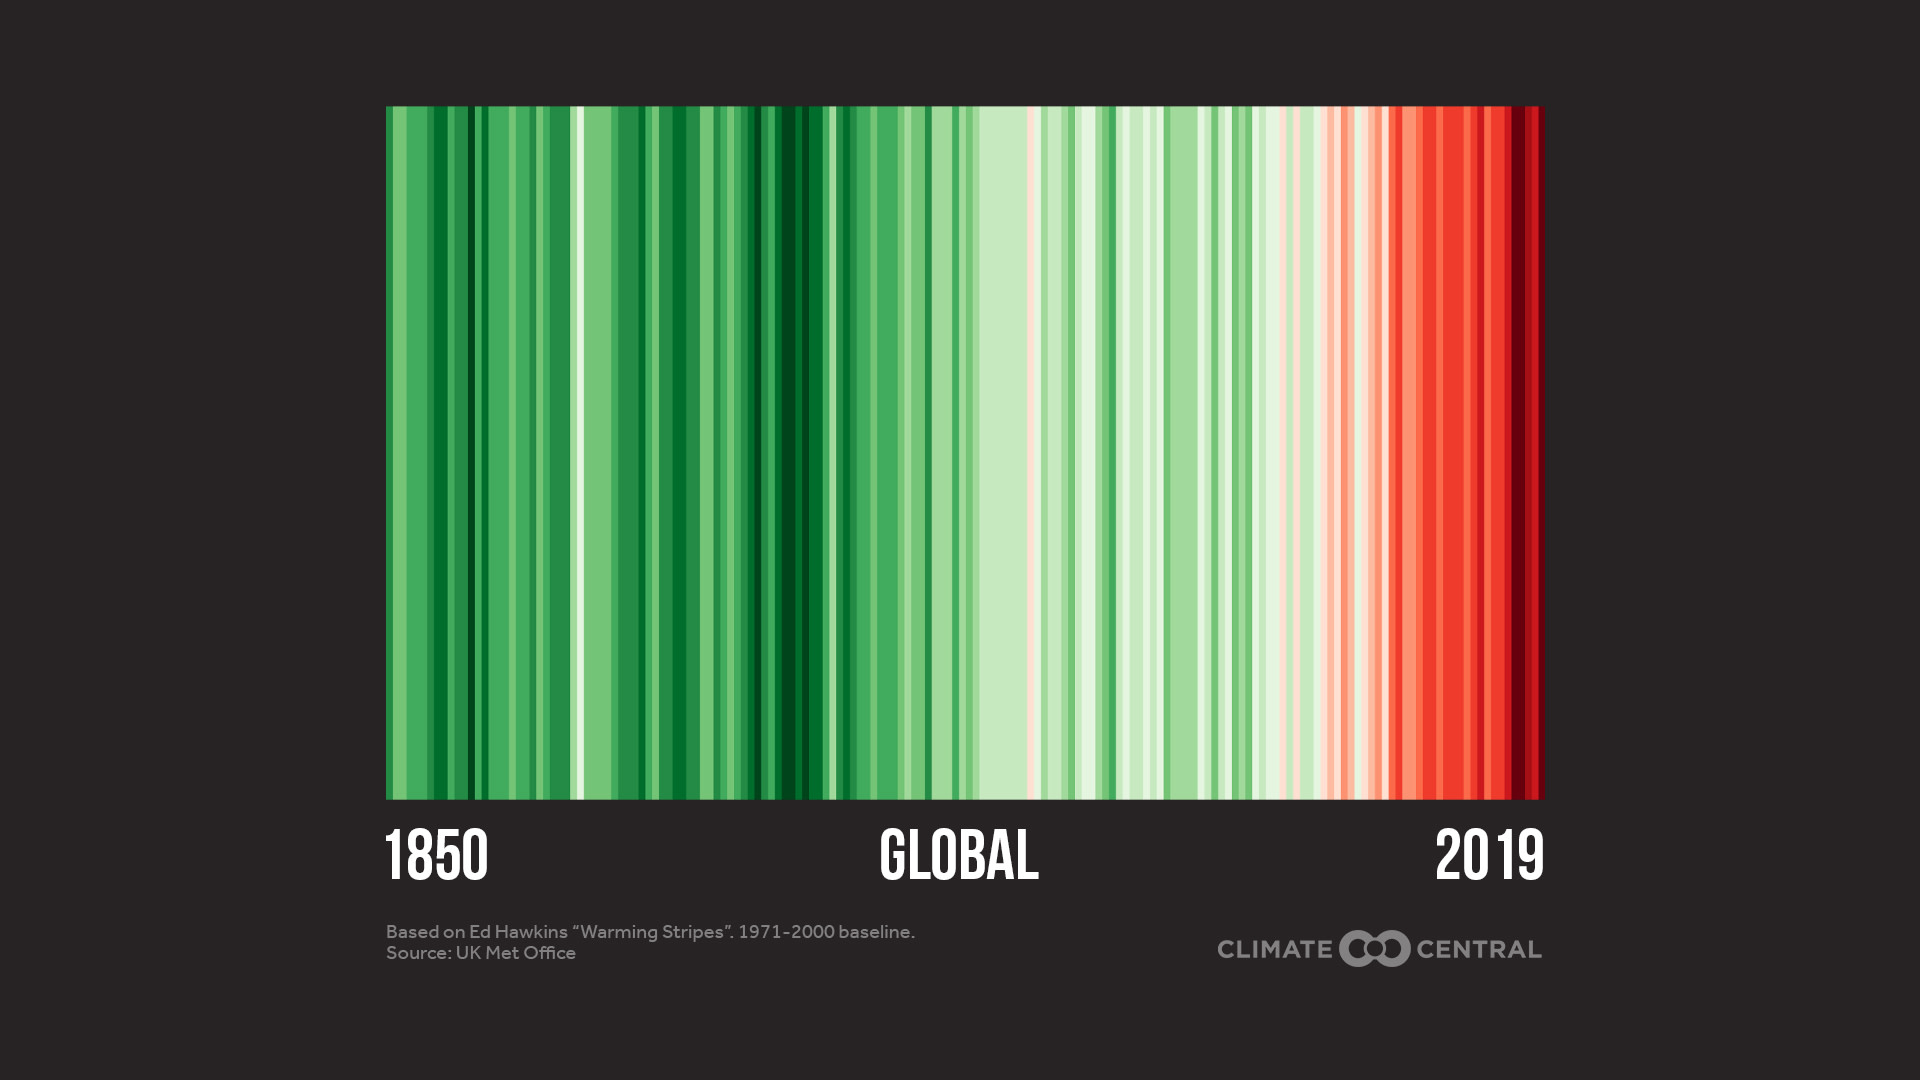
The original red & blue visual depicts the annual temperature anomalies (the differences from the long-term average) from 1850 to 2019—and quickly became an iconic symbol in the climate change community. The blue stripes represent temperatures lower than average and red, above. But for our holiday edition, we present the stripes in festive red and green.
In our first graphic, Santa, you can see the holiday-themed global warming stripes. Progressing from green to a sharp burst of red, the stripes depict unprecedented warming of global temperatures over the past 170 years. This warming is primarily a result of years of burning fossil fuels and accumulating carbon dioxide along with other greenhouse gases in the atmosphere. Although we display these stripes in festive colors, this is not something to be jolly about.
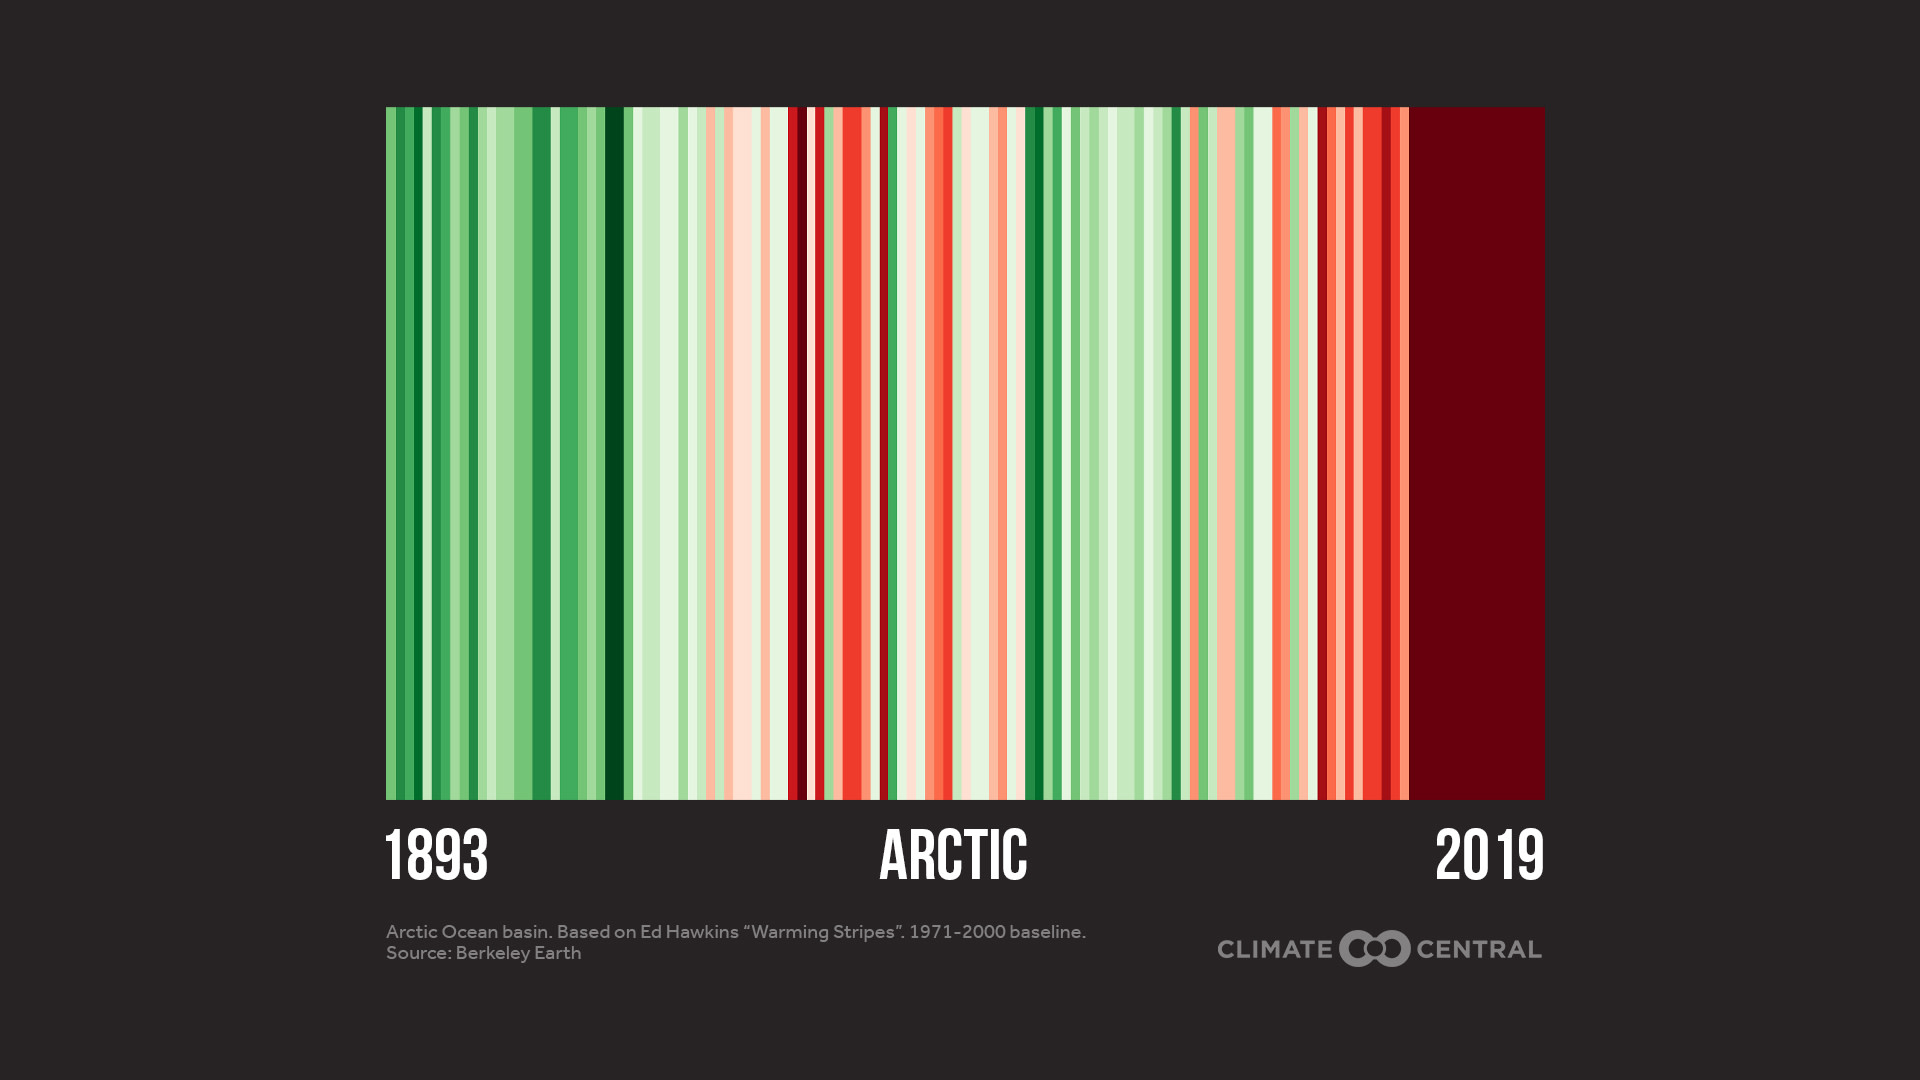
And of course, how could we not include the warming stripes of your home, the North Pole.
If the global warming stripes didn’t grab your attention, then the Arctic warming stripes will make you “Ho, ho, hold up!” Over the past two decades, the Arctic has warmed at more than double the rate of the global average. You can see this as the Arctic stripes rapidly become redder than Rudolph’s nose (breaking the warming stripes color scale). The disproportionate warming (mainly due to ice-albedo feedback from snow and sea ice cover loss) creates many negative consequences for your region's ecosystem and the planet as a whole. For instance, the year 2020 had the second-lowest sea ice minimum on record, and high temperatures and fires melted permafrost and released tons of methane.
As you can see, Santa, climate change is in your backyard as well as ours. The increases of global average temperatures have negatively impacted—and will continue to impact—the natural world and humans unless we do something. All we ask for is some Christmas spirit, so Santa, help us stabilize our climate and keep those White Christmases coming for years to come. And even if we've been challenged at times this year, please no lumps of coal in our Christmas stocking!
Happy Holidays,
Climate Central
White ChristmasFake or Real? The Great Christmas Tree Debate


POTENTIAL LOCAL STORY ANGLES
How can I get warming stripes for my area?
Download and display your area’s warming stripes in the original red and blue from our media library, and share it using #ShowYourStripes. To get stripes for other countries and the oceans, go to Ed Hawkins’ site at showyourstipes.info. You can also find county stripes from scientist Jared Rennie.
How is climate change affecting the Arctic region?
To get an overview of how climate change affects the Arctic region, check out NOAA’s 2020 Arctic Report Card. NASA also provides animations and videos on sea ice minimums, the albedo effect, and how researchers measure sea ice thickness.
LOCAL EXPERTS
The SciLine service, 500 Women Scientists, or the press offices of local universities may be able to connect you with local scientists who have expertise on climate change in your area. The American Association of State Climatologists is a professional scientific organization composed of all 50 state climatologists.
NATIONAL EXPERT
Ed Hawkins, Ph.D.
Professor of Climate Science, University of Reading
Creator of the Warming Stripes
Email: e.hawkins@reading.ac.ukAndrew Pershing, Ph.D.
Director of Climate Science, Climate Central
Staff-nominated spokesperson for Santa on Arctic climate impacts from the North Pole southward
Email: apershing@climatecentral.org
METHODOLOGY
Methodology for the warming stripes can be found at https://showyourstripes.info/faq.