Climate Matters•July 18, 2018
Heat Review — Halfway through 2018

With the release of the monthly global temperature analysis from NOAA today, it is a good opportunity to compare temperatures so far this year to their historical levels. And as greenhouse gases continue to accumulate in the atmosphere, the heat goes on both globally and here in the United States.
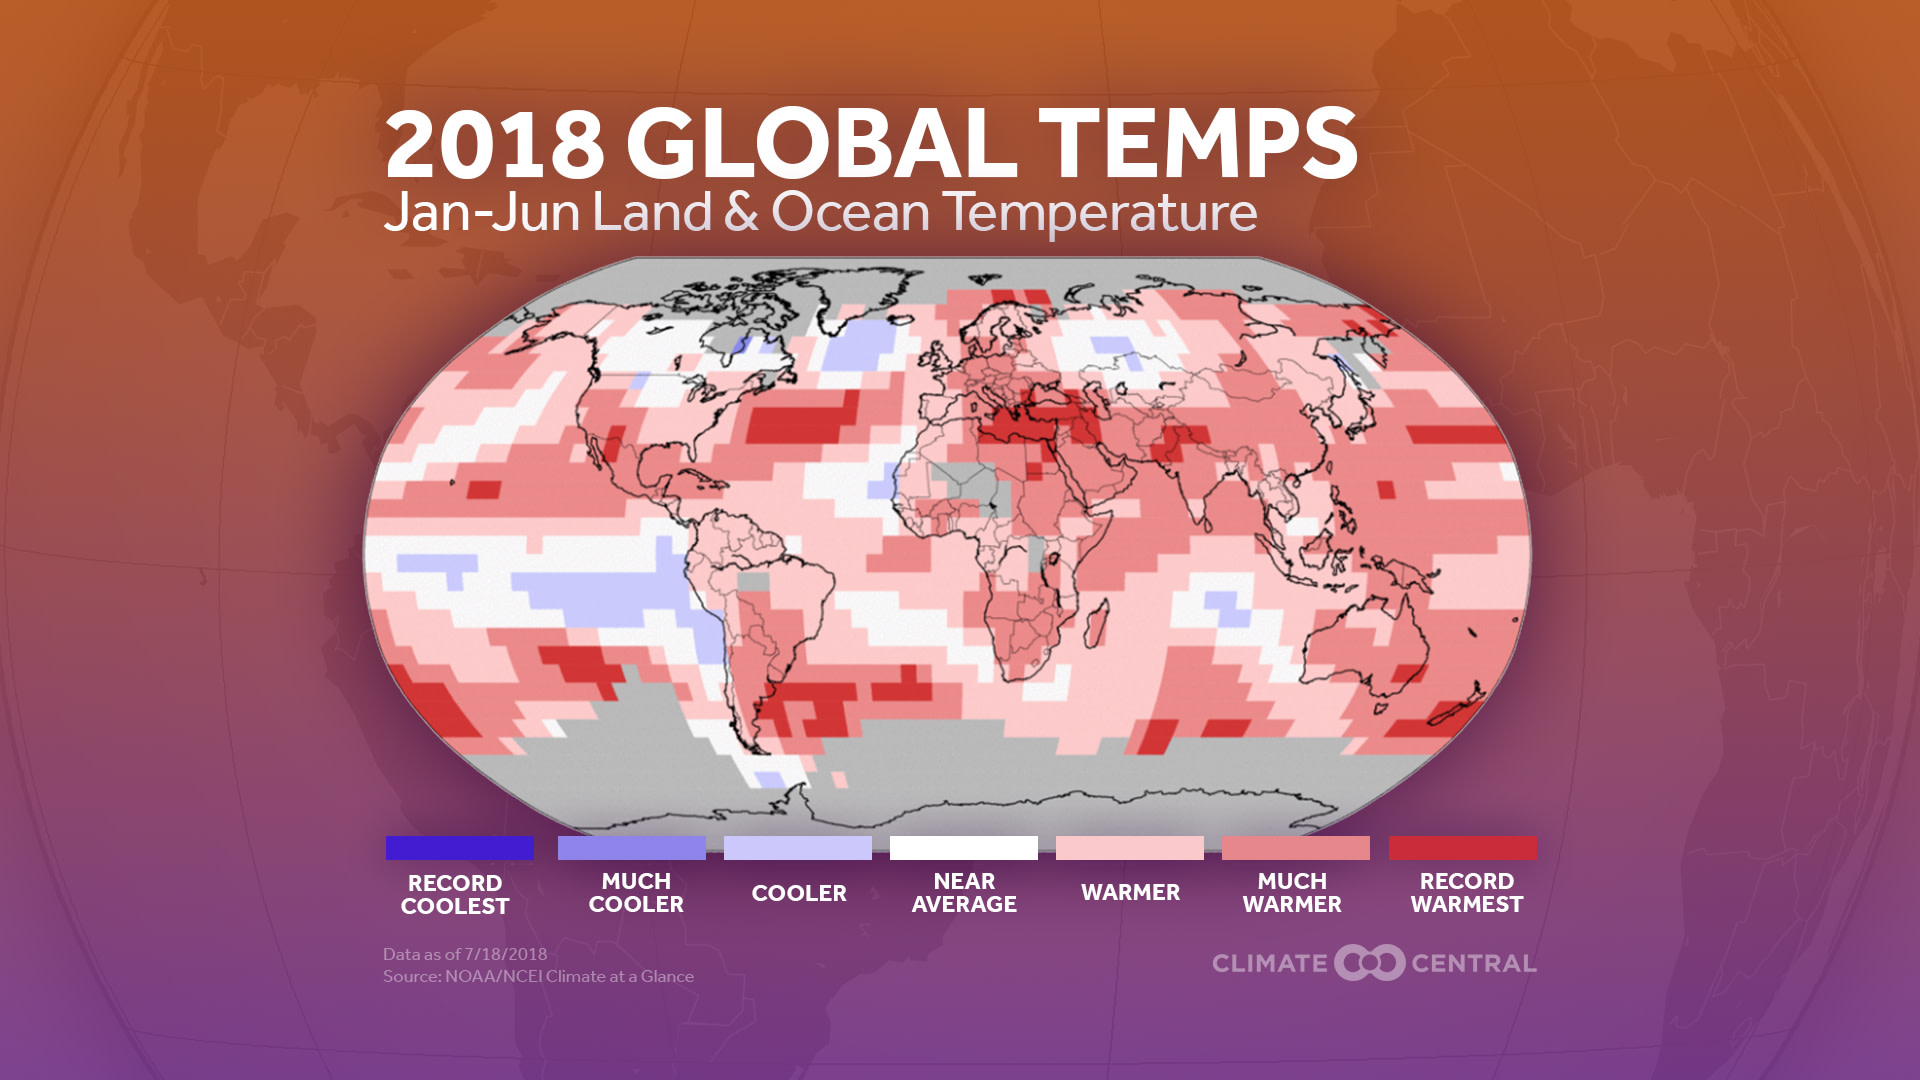
— World —
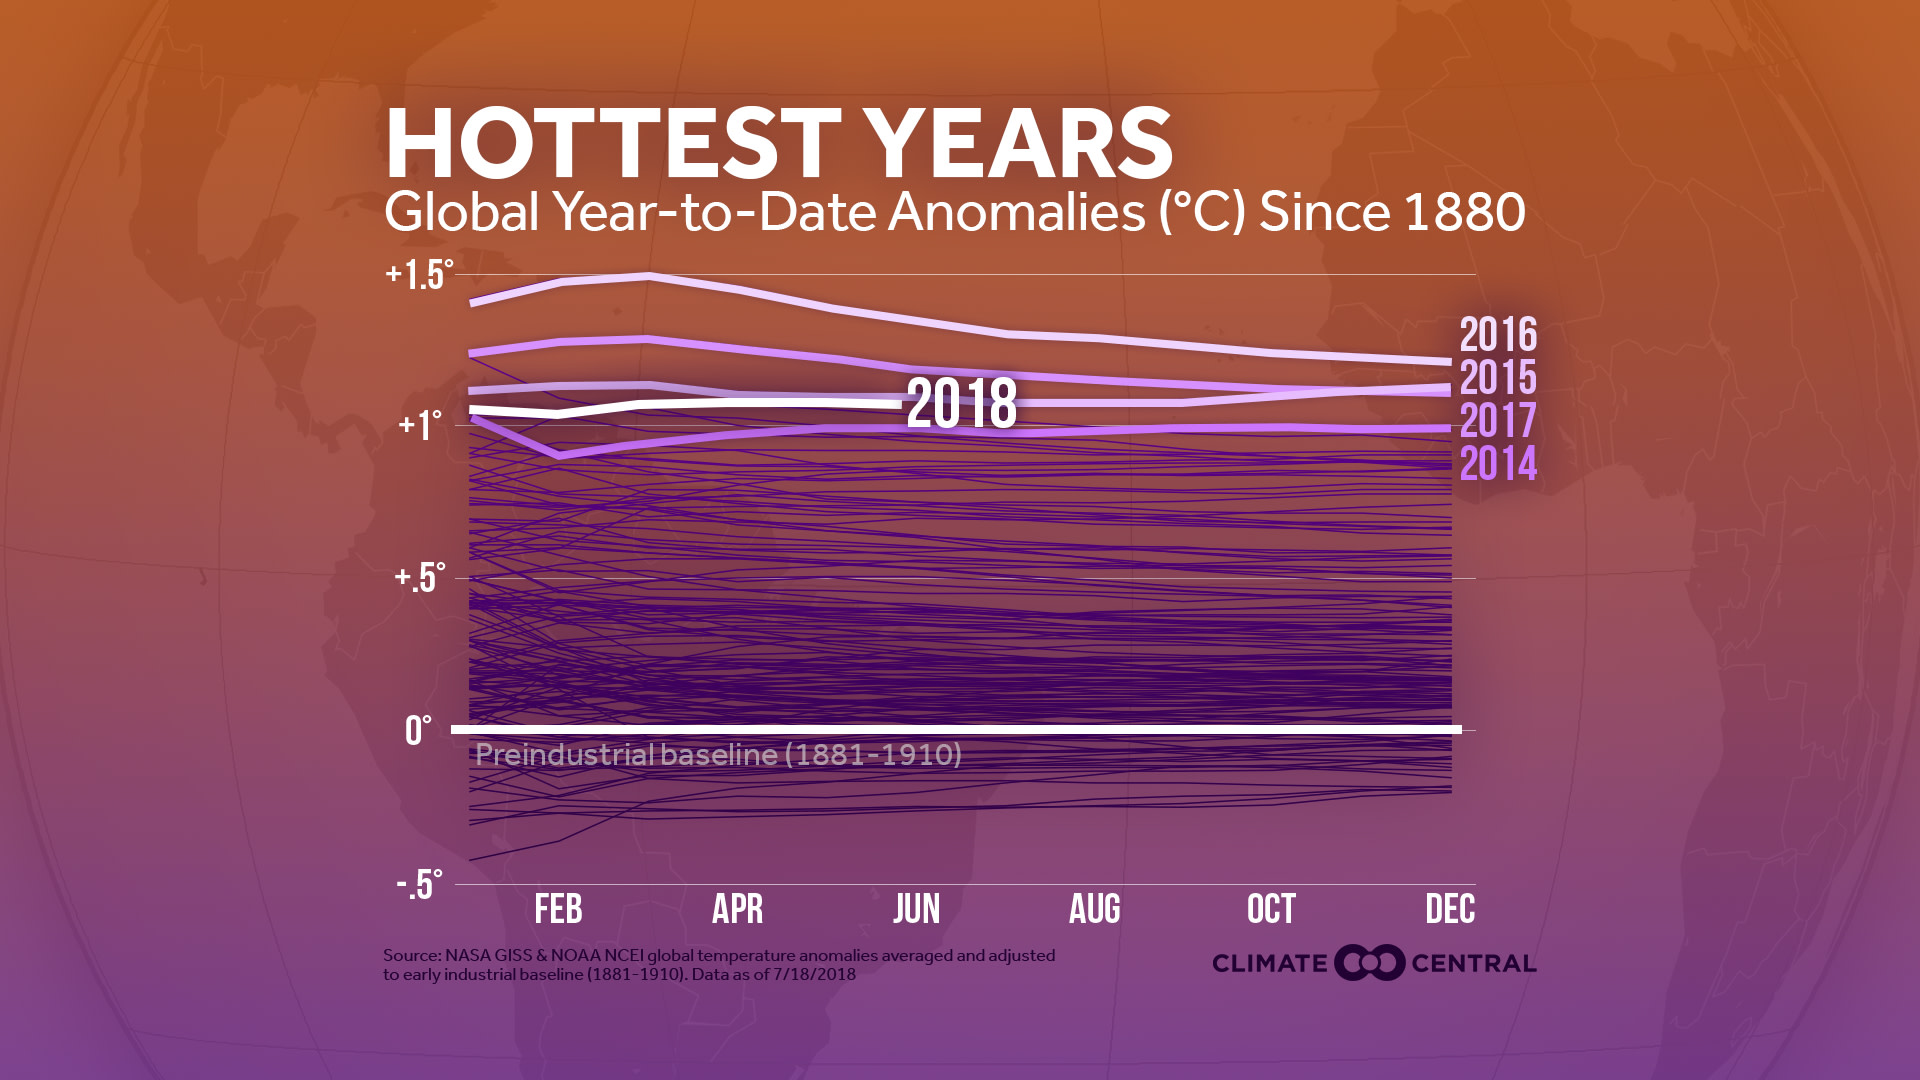
Globally, the past four years have been the hottest four years on record, and 2018 so far is coming in as the 4th hottest. All-time record heat has peppered the Northern Hemisphere this summer. Here a few stats compiled by Weather Underground:
Glasgow, Scotland had its hottest day on record, reaching 89°F on June 28.
Montreal, Canada set a new all-time high, reaching 98°F on June 29.
Ouargla, Algeria had the highest temperature on record in Africa, reaching 124°F on July 5. This is believed to be the hottest temperature reliably measured in Africa.
Tianxiang, Taiwan had the hottest temperature on record in Taiwan, reaching 105°F on July 10.
According to the WMO, 2018 has been the hottest La Niña year on record, with La Niña years today consistently warmer than El Niño years from 30 years ago. Consensus forecasts are trending toward a new El Niño before the end of the year, meaning 2018 will probably finish as one of the 10 hottest years on record globally.
To better reflect how much temperatures have warmed since the early industrial era, our main graphic this week combines the global NOAA and NASA monthly temperature analyses to determine how much warming has taken place relative to a 1881-1910 baseline.

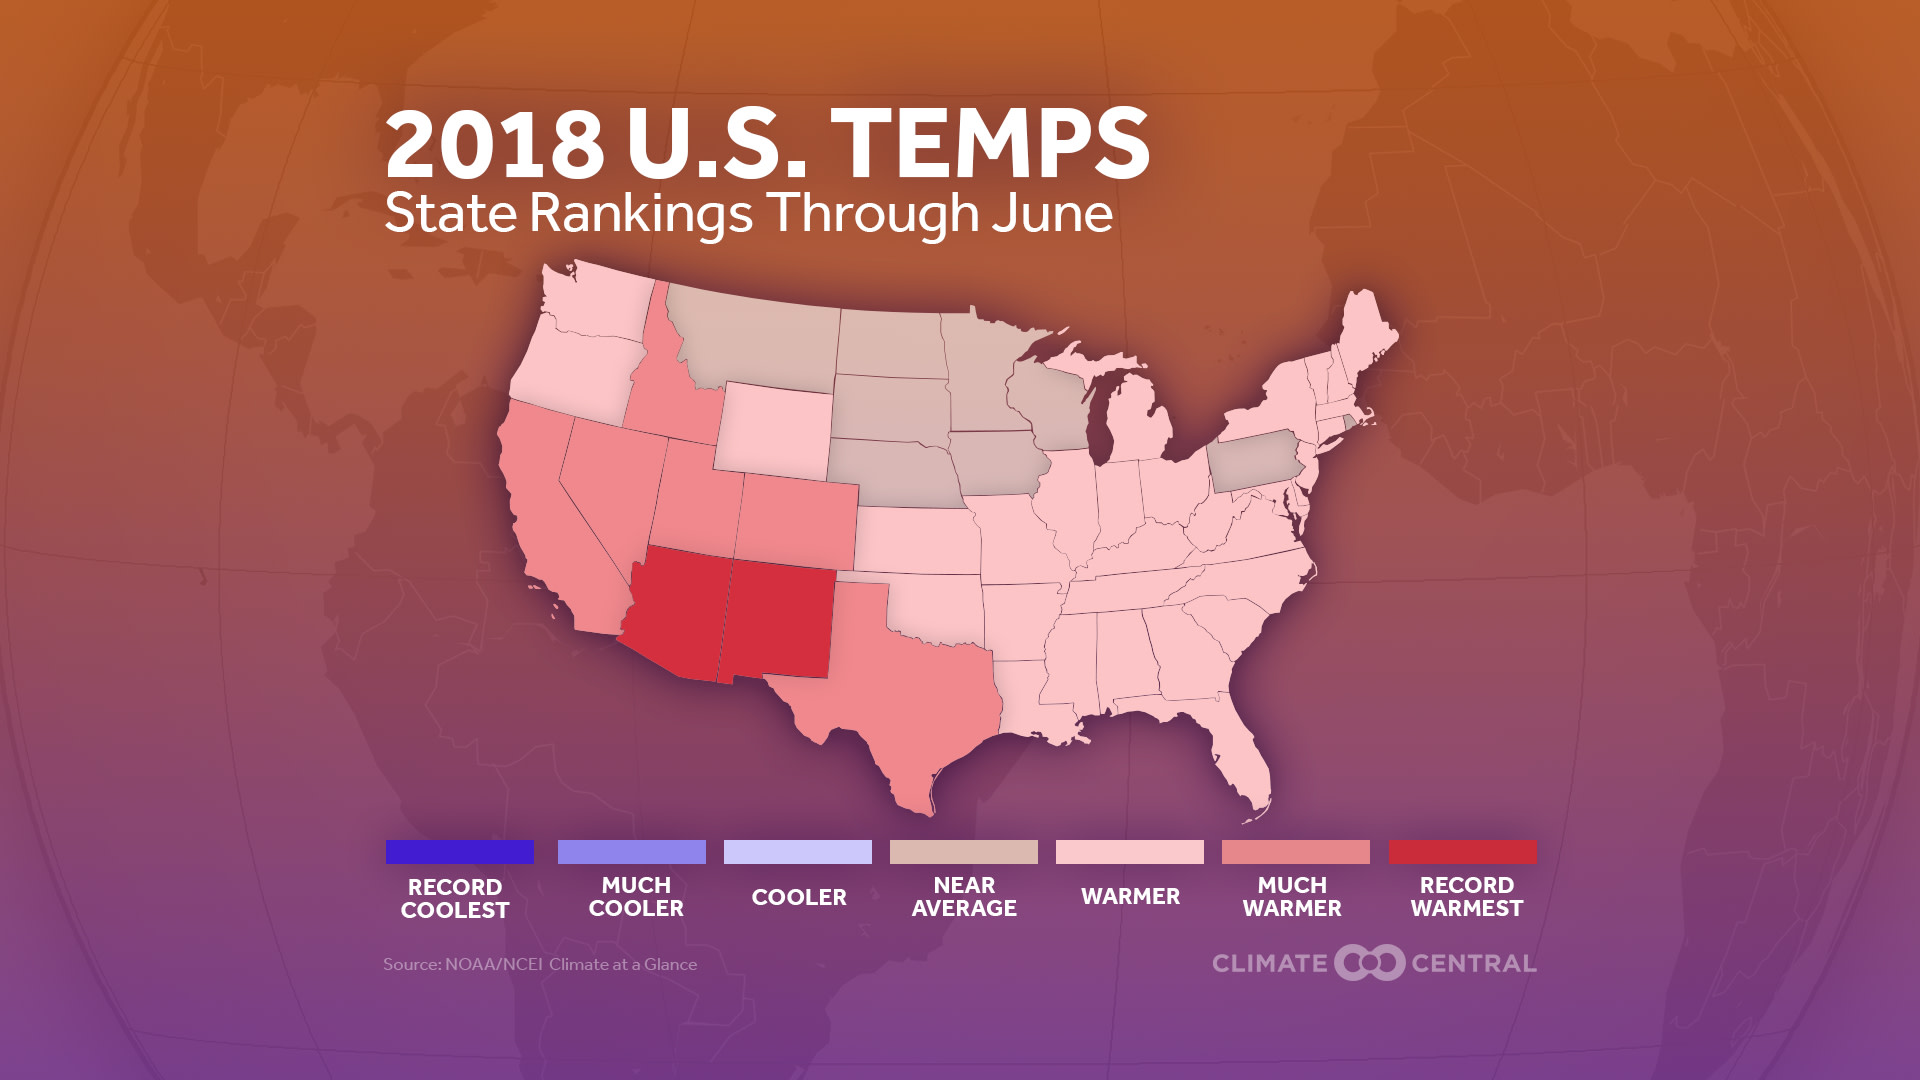
— U.S. —
Despite a cold April, 2018 is the 14th warmest year on record so far in the U.S. Half way through the year, Arizona and New Mexico are record hot, and the remaining southwestern states are each having one of their 10 hottest years. In fact, the four hottest years in the U.S. have all come in the decade of the 2010s.

July has been a scorcher from West to East. On July 6, the temperature on the UCLA campus reached 111°F, breaking the all-time record high of 109°F set in 1939. That same day in downtown Los Angeles, a new daily record high of 108°F smashed the previous one by 14°F (94°F in 1992). Famously cold Mount Washington, New Hampshire (elevation 6289’) did not drop below 60°F on July 3, tying its all-time warmest low temperature record. Other weather extremes have led to six separate billion-dollar disasters so far in 2018, on the same pace as the number of these disasters in 2008 and 2012.
Methodology: U.S. and global temperature rankings referred to in the text above are calculated by NOAA/NCEI. Monthly global temperature analyses are also independently calculated by NASA. Climate Central combines the NOAA and NASA information to re-baseline global temperatures using an earlier pre-industrial baseline of 1881-1910 in response to the Paris Climate Change Agreement.