Climate Matters•October 2, 2019
Fall Days Above Normal
We recently celebrated the autumn equinox, signaling the beginning of astronomical fall. However, fall’s arrival has been rather anticlimactic so far—with hot and humid conditions still in place across much of the United States. Several areas in the Plains, Gulf Coast and Southeast had one of their hottest Septembers on local record.
Last month we looked at how average fall temperatures have been trending in the U.S., finding that 95% of cities analyzed recorded an increase in average temperatures over the past half-century. This week, we focus on trends in the number of warmer-than-normal fall days.
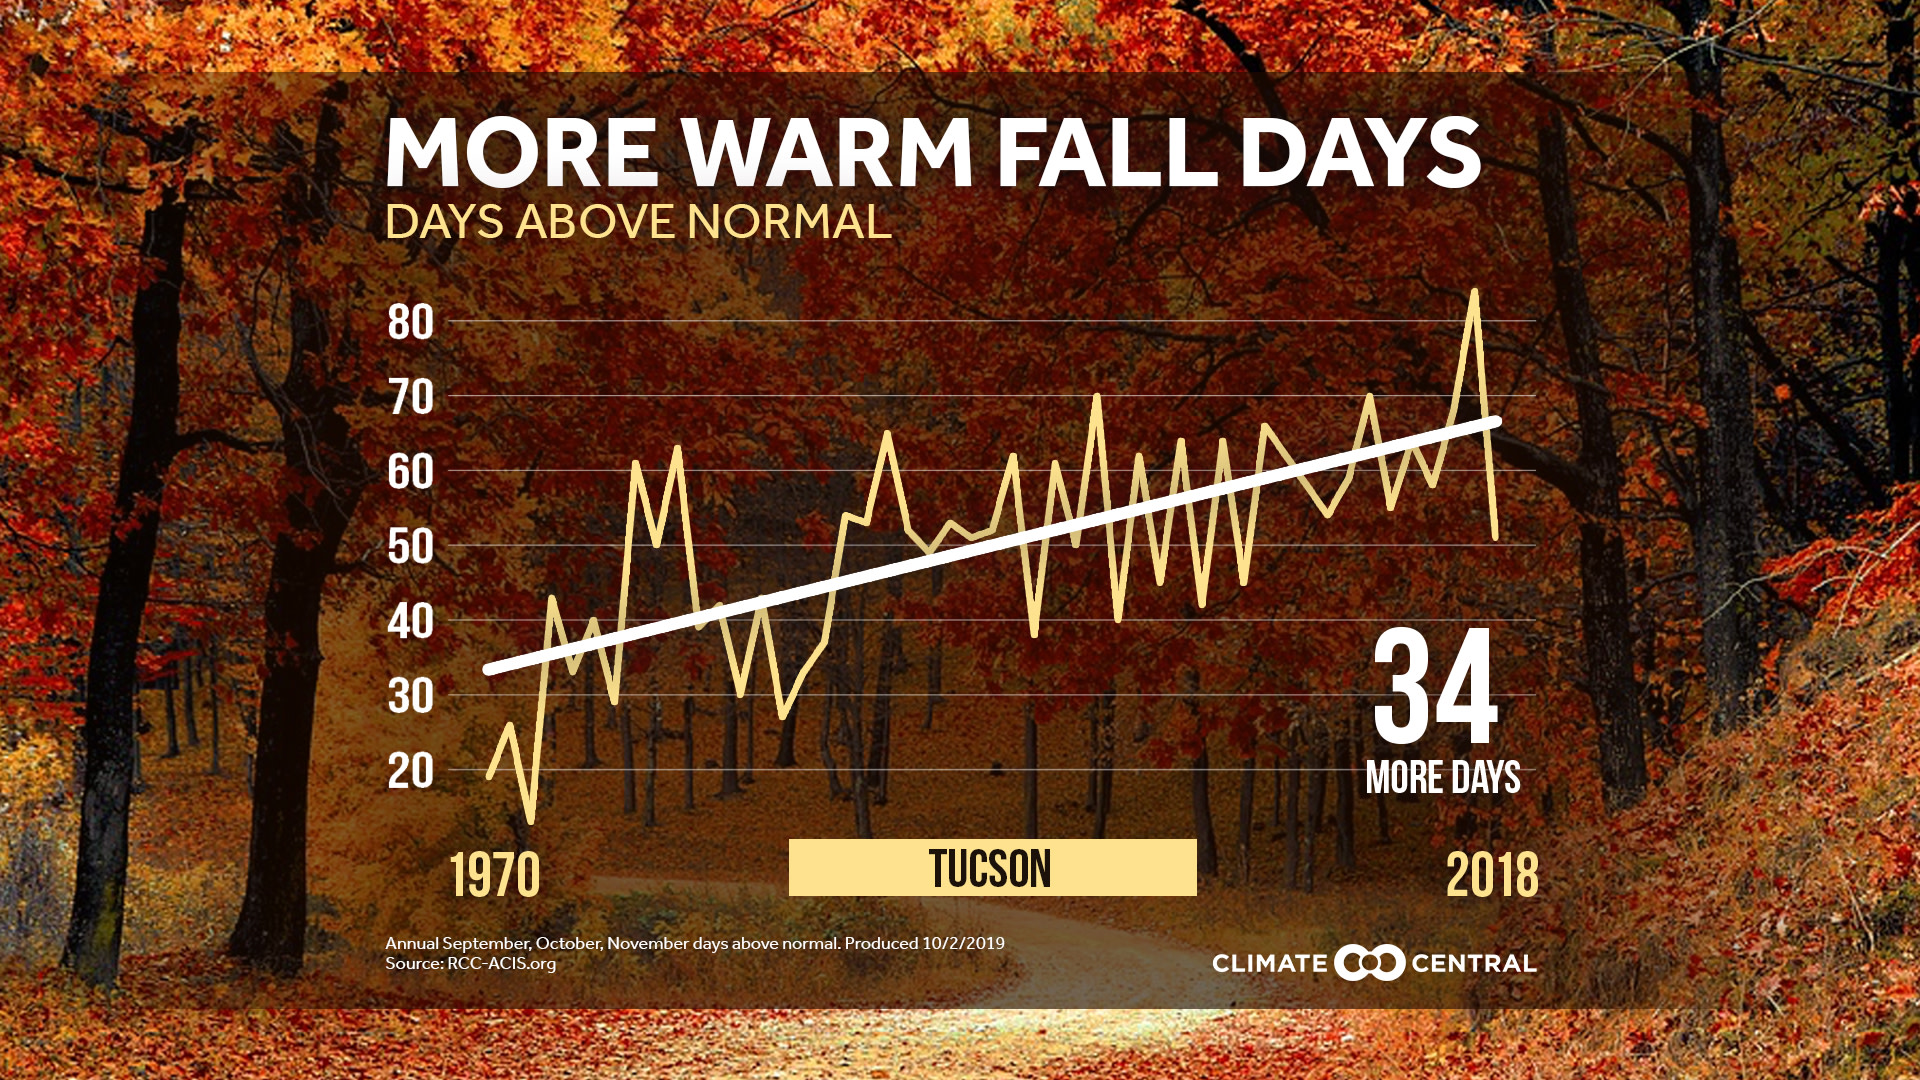
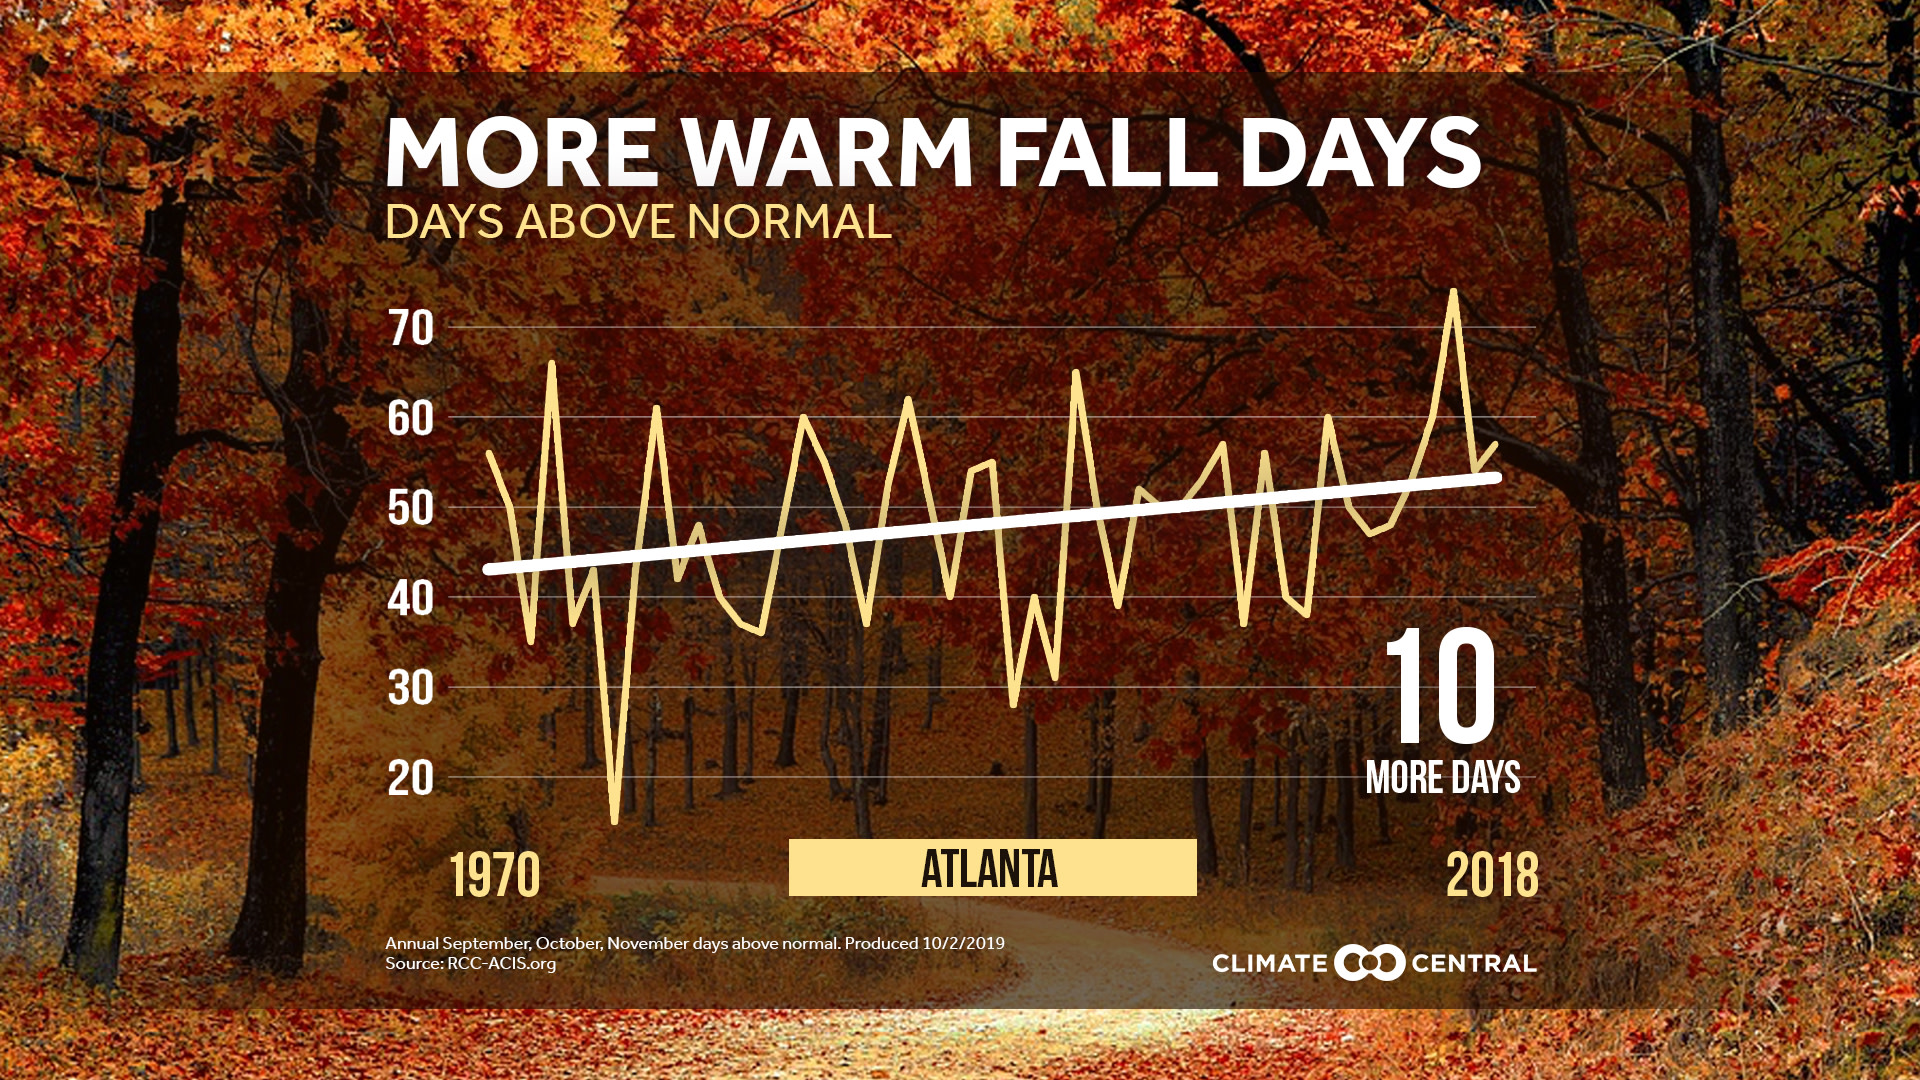
Of 243 cities analyzed, 92% (223) have experienced an increase in the number of fall days above normal since 1970—half of which have recorded an increase of 10 days or more. Of the cities with the most days above normal, nine of the top ten are in the western United States—led by Reno, NV (44 days), Las Vegas, NV (37), Phoenix, AZ and Las Cruces, NM (35), and Tucson, AZ (34).
The persistence of higher temperatures into the fall means extended seasons for pests such as ticks and mosquitoes, leading to an increased risk of disease transmission. These trends are of particular concern in parts of the country which have experienced outbreaks of Eastern equine encephalitis (EEE) and West Nile virus. The warming fall prolongs ragweed season as well, so those with allergies will deal with them longer into the fall.
The warmer start to fall can also affect foliage—with some research suggesting that changes in temperature and precipitation could make the timing of leaf turn less predictable, while extreme weather and other climatic stressors could dull fall colors. Autumn tourism is worth billions of dollars in the northeastern United States alone, where ‘leaf peeping’ draws fans of the fall colors to admire the changing foliage.
JOURNALISTS:
To find more information and reporting resources (such as potential story angles, local interview suggestions, and national contacts), please refer to our Climate Matters in the Newsroom release on fall warming.
METHODOLOGY
Individual city trends are calculated using data from the Applied Climate Information System for September through November based on the number of days with temperatures greater than the 1981-2010 NCEI climate normal. Displayed trend lines on are based on a mathematical linear regression. Climate Central's local analyses include 244 stations. However, for data summaries based on linear trends, only 243 stations are included due to large data gaps in St. Johnsbury, Vermont.