Climate Matters•April 20, 2022
Earth Day: U.S. Warming Rankings
KEY CONCEPTS
The U.S. has warmed by 2.6°F since the first Earth Day was celebrated on April 22, 1970.
49 states and 99% of 246 U.S. cities analyzed by Climate Central have warmed since 1970.
The fastest-warming city was Reno, Nev. and the fastest-warming state was Alaska.
Continued warming can harm people and the planet, but there are many ways to cut heat-trapping emissions from energy, transportation, agriculture, and more.
Happy Earth Day!
Since the first Earth Day 52 years ago, environmental science, policy, and public awareness have transformed in the U.S. and around the world. Earth Day is a time to celebrate this progress and take stock of current challenges—including climate change.
The concentration of heat-trapping CO2 in the atmosphere has increased nearly 30% since the first Earth Day in 1970. And when CO2 increases, temperatures follow suit. How has rising CO2 affected temperatures in the U.S.?
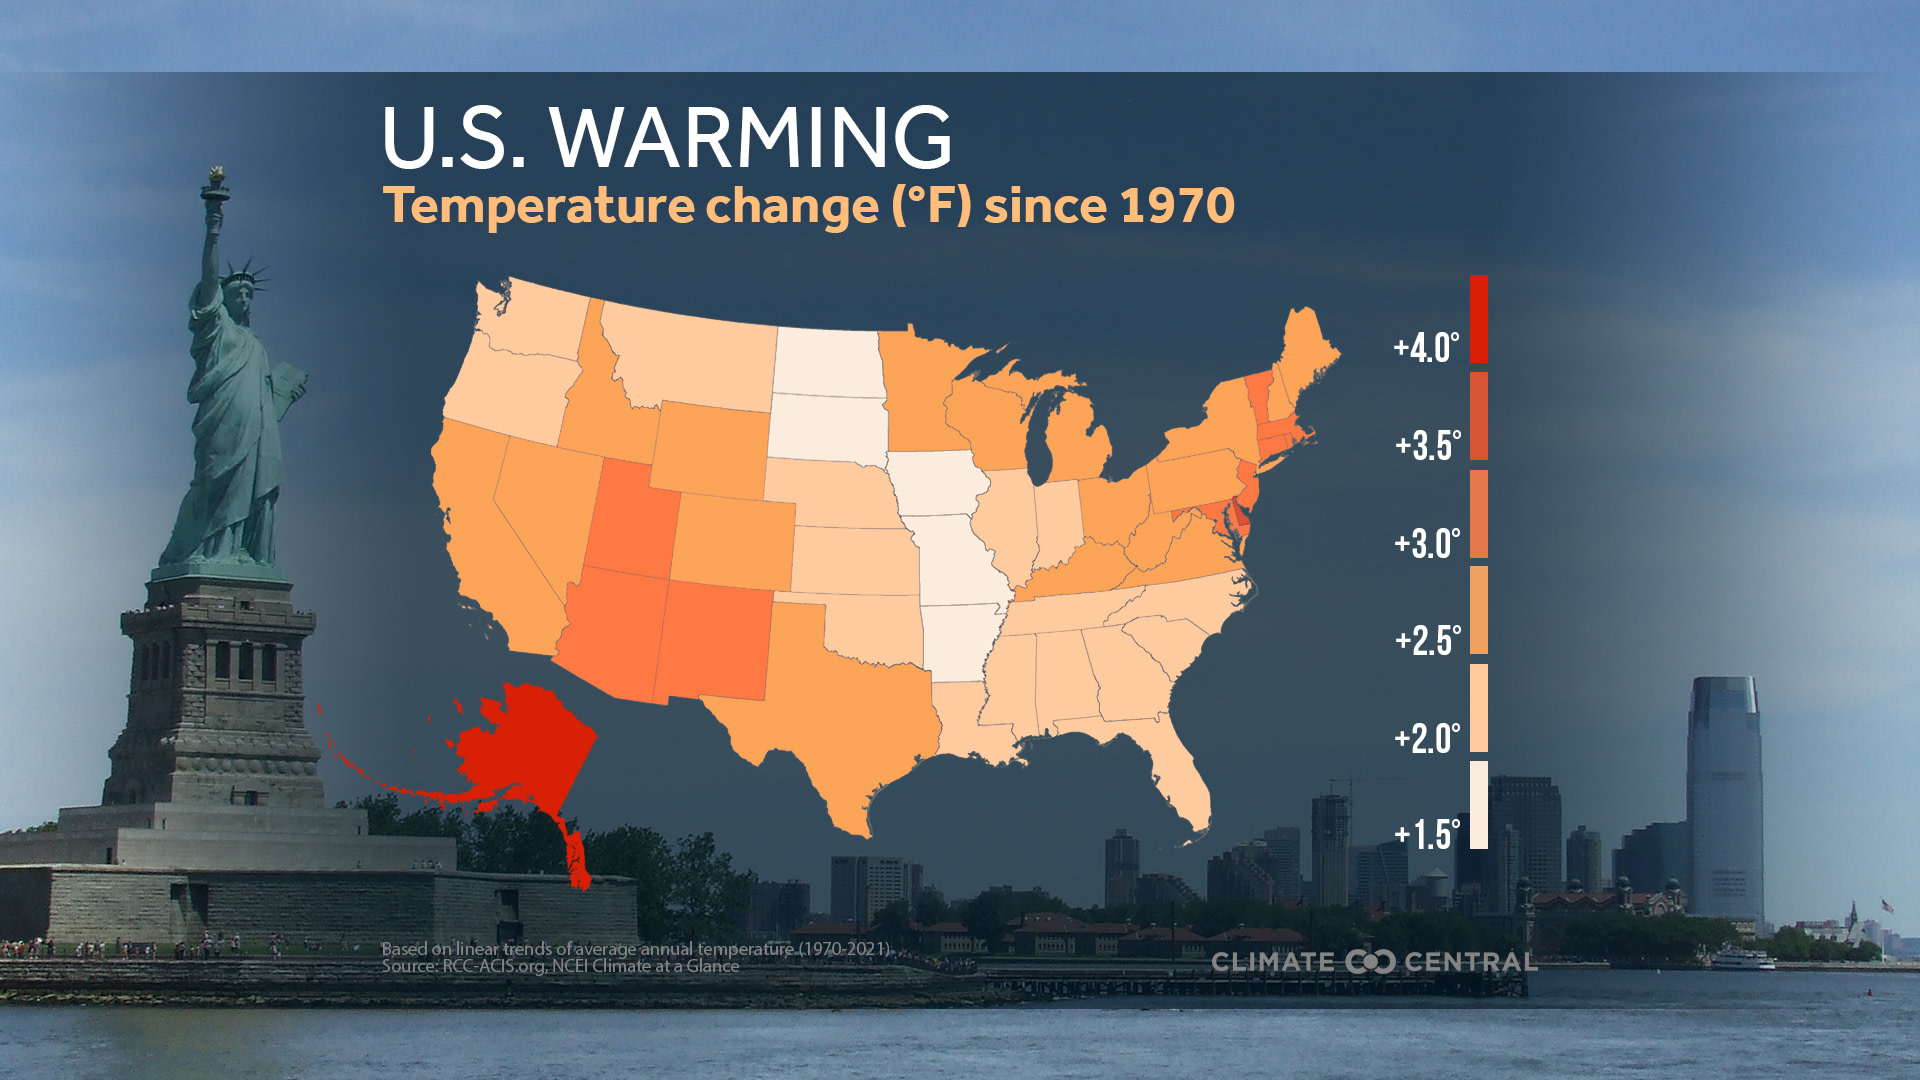
Widespread U.S. warming since the first Earth Day.
Climate Central analyzed trends in annual average temperature in 246 locations, all 49 states (Hawaii was excluded; see methodology), and the entire nation since 1970 and found that:
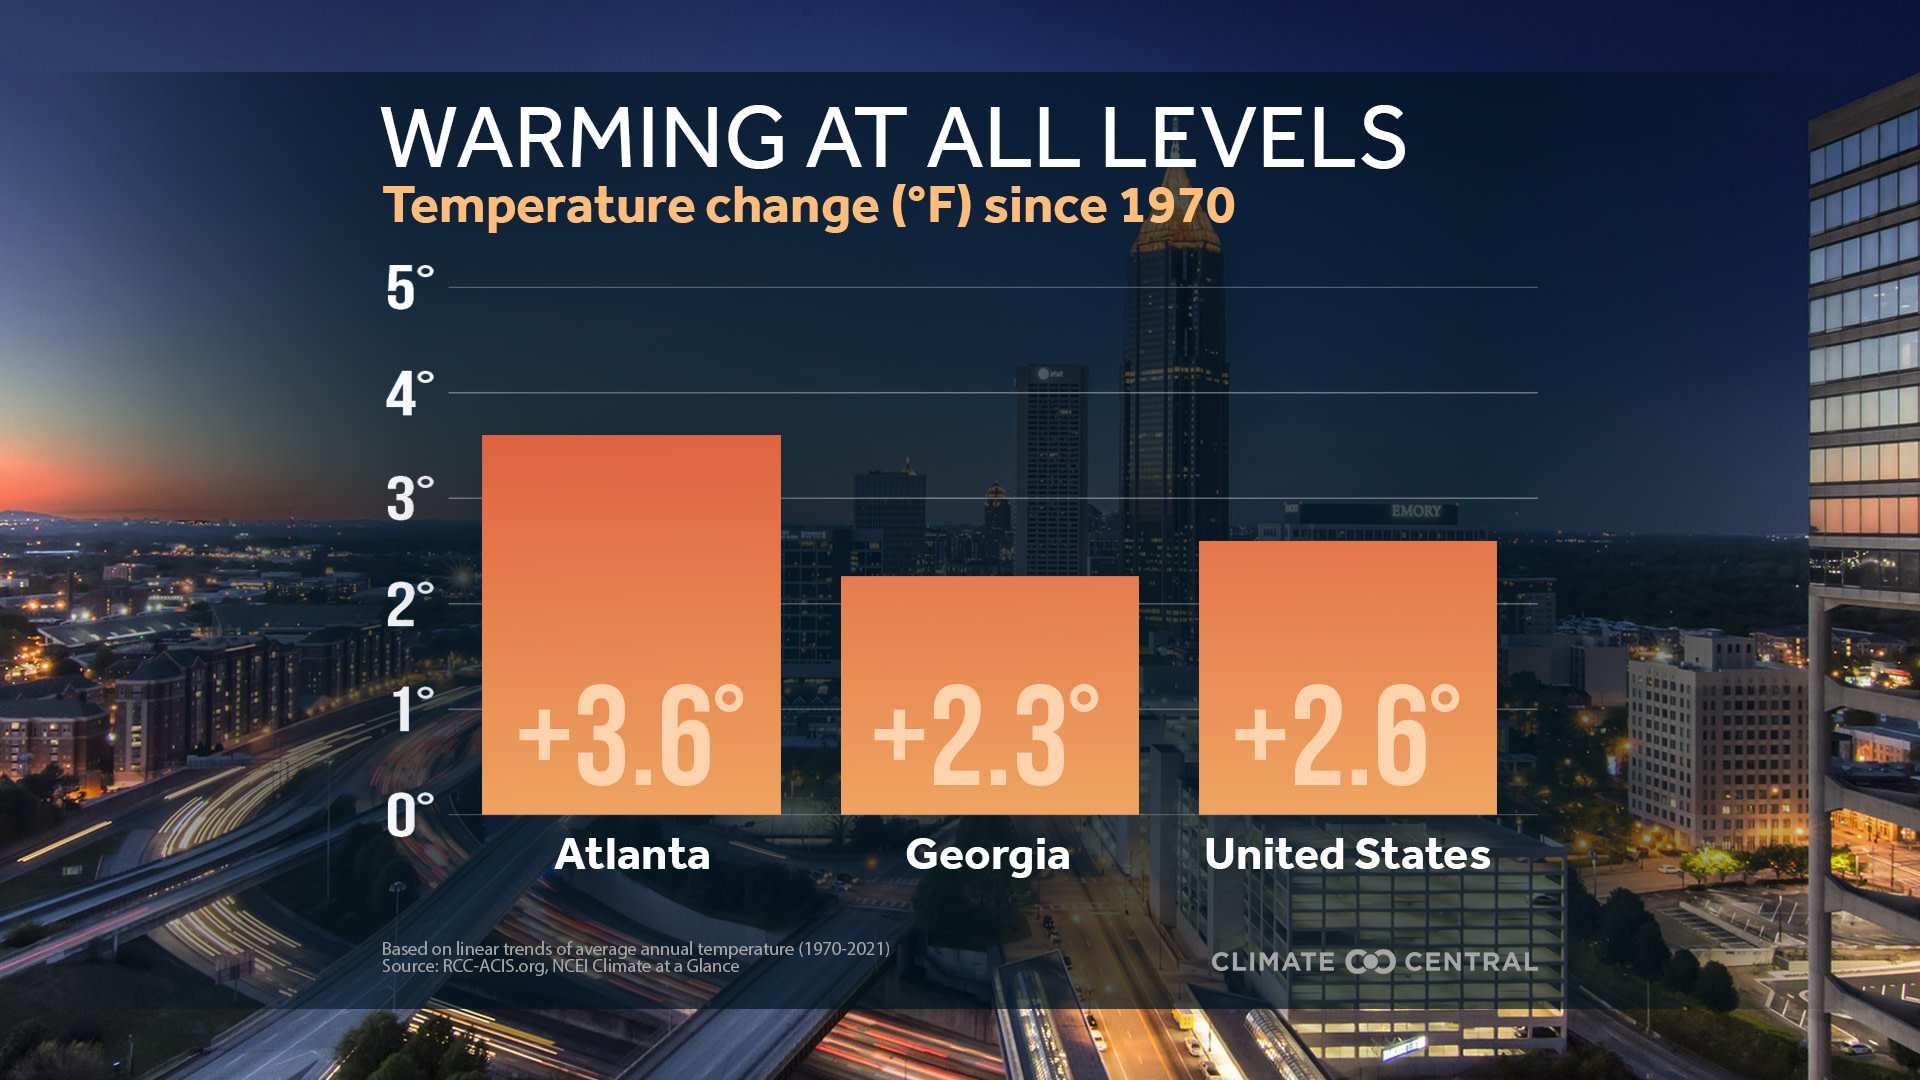
The U.S. is 2.6 °F warmer today than it was in 1970.
For context, 2.6 °F is very close to the global warming limit of 2.7 °F (1.5 °C) that 196 countries, including the U.S., have agreed to pursue.
All 49 states analyzed have warmed by at least 1.8 °F since the first Earth Day.
Alaska was the fastest-warming state by far, due to its high latitude. Melting glaciers and permafrost are contributing to sea level rise and greenhouse gas release.
99% (244) of 246 U.S. cities analyzed have warmed since 1970.
69% (170) of locations have experienced at least 2 °F of warming.
Many of the fastest-warming locations were in the Southwest—a region vulnerable to droughts and heat extremes, which are likely to worsen with climate change.
The fastest-warming U.S. cities and states based on the increase in annual average temperature since 1970 were:
Fastest-warming cities (°F)Fast-warming states (°F)Reno, Nev. (+7.7°)Alaska (+4.3°)Las Vegas, Nev. (+5.9°)Delaware (+3.5°)El Paso, Texas (+5.1°)New Mexico (+3.5°)Erie, Pa. (+4.7°)New Jersey (+3.4°)Tucson, Ariz. (+4.6°)Arizona (+3.3°)Chattanooga, Tenn. (+4.6°)Rhode Island (+3.2°)Burlington, Vt. (+4.5°)Massachusetts (+3.2°)Phoenix, Ariz. (+4.3°)Connecticut (+3.2°)McAllen, Texas (+4.1°)Utah (+3.0°)Helena, Mont. (+4.1°)Vermont (+3.0°)
Curbing emissions to celebrate Earth.
Warming is one of many ways that continued emissions of heat-trapping gasses like CO2 impact our planet, our communities, and our food and water supplies.
Recent IPCC reports review the escalating impacts of climate change on people and nature, and assess ways to limit global warming and minimize further harm to people and the planet.
These scientific reports make clear that staying within the globally-agreed warming limit of 3.6 °F (2 °C) will be an immense challenge—but that the benefits of limiting warming would likely outweigh the costs of mitigation. These reports also make clear that climate solutions already exist for every major economic sector—including energy, transportation and agriculture.
POTENTIAL LOCAL STORY ANGLES
How are people and organizations celebrating Earth Day in your area?
Use the “Find An Earth Day Event '' tool on the official Earth Day site to explore how people and organizations around the world are celebrating this year. You can narrow down the search by event type, location, and online vs in-person. Here is a link to Earth Day’s live webinar and a list of environmental education webinars.
Where can I learn more about climate solutions?
Search the Climate Matters Media Library for ‘Solutions,’ which includes research reports and local graphics on renewable energy, sustainable infrastructure, electric vehicles, and more. The most recent report from the United Nations Intergovernmental Panel on Climate Change assesses climate change mitigation pathways in detail, along with reporting resources.
LOCAL EXPERTS
The SciLine service, 500 Women Scientists or the press offices of local universities may be able to connect you with local scientists who have expertise on warming and environmental policy. The American Association of State Climatologists is a professional scientific organization composed of all state climatologists.
NATIONAL EXPERTS
Daniel Ruiz Carrascal, PhD
Associate Research Scientist, Department of Ecology, Evolution and Environmental Biology
Lecturer, Columbia Climate School, Columbia University
pfcarlos@iri.columbia.edu
Related expertise: climate science, hydrology, environmental health
Available for interviews in SpanishChristie Manning, PhD
Assistant Professor of Environmental Studies and Director of Sustainability, Macalester College
cmanning@macalester.edu
Related expertise: environmental psychology, sustainable behavior, climate & mental health
METHODOLOGY
Local analyses used 1970-2021 data from the Applied Climate Information System. State and U.S. temperature data were obtained from NOAA/NCEI’s Climate at a Glance. A state trend for Hawaii was not calculated because it is not included in the NOAA/NCEI dataset. Trends are based on a mathematical linear trend line, beginning in 1970 for consistency between all 247 stations.However, for data summaries based on linear trends, only 246 stations are included due to large data gaps in Wheeling, W. Va.