Climate Matters•October 6, 2021
Disaster Fatigue

KEY CONCEPTS
Using NOAA/NCEI data, Climate Central identified a marked increase in the frequency of billion-dollar weather and climate disasters in the U.S. since 1980.
The average time between billion-dollar disasters—time to help communities across the nation recover—has dropped from 82 days in the 1980s to just 18 days on average in the last five years (2016-2020).
The higher frequency of disasters—which is projected to increase further with rising global temperatures—can strain the resources available for communities to recover quickly and manage future risks.
On October 8, NOAA will release an updated analysis of 2021’s billion-dollar disasters across the U.S., which is already tracking well above the historical average of 7 events per year. The October release will reflect this year’s summer of extremes, including record-shattering heatwaves, relentless wildfires, and devastating tropical cyclones.
Costly Trends: The number of billion-dollar weather and climate disasters (including tropical cyclones, wildfires, heatwaves, droughts, floods, and severe storms) to hit the U.S. each year has been increasing—from an average of 3 events per year in the 1980s to 12 events per year in the 2010s.
Last year saw a record-shattering total of 22 billion-dollar weather and climate disasters in the U.S., costing a combined $99 billion (CPI-adjusted) in damages, according to NOAA.
The last five years alone account for nearly a third (31.8%) of the $1.98 trillion in total costs of billion-dollar disasters nationwide since 1980.
These staggering figures primarily reflect direct impacts on assets (including damage to homes, crops, and critical infrastructure) and therefore don’t reflect the full toll of disasters—including on human health and well-being, displacement, food and water supplies, as well as loss of cultural heritage, biodiversity and habitats. Nor do these figures convey the disproportionate impacts of disasters on people in poverty or the need for equitable allocation of federal disaster assistance in accordance with social vulnerability.
2021 Among Record Holders: The total number of billion-dollar disasters across the U.S. this year is already tracking well above the historical average of 7 events per year since NOAA started tracking in 1980.
As of July 9, this year’s toll was already 331 lives lost and $29.4 billion in damages.
On October 8, NOAA is set to release updates on 2021’s billion-dollar disasters (see NOAA/NCEI), which will reflect some of the events of 2021’s summer of extremes, including:
Ongoing western U.S. drought
Relentless wildfire season throughout the western U.S.
Record-shattering extreme heat in the Pacific northwest of the U.S. and Canada
Tropical cyclones that have devastated parts of the Caribbean, Gulf Coast and Northeastern U.S.
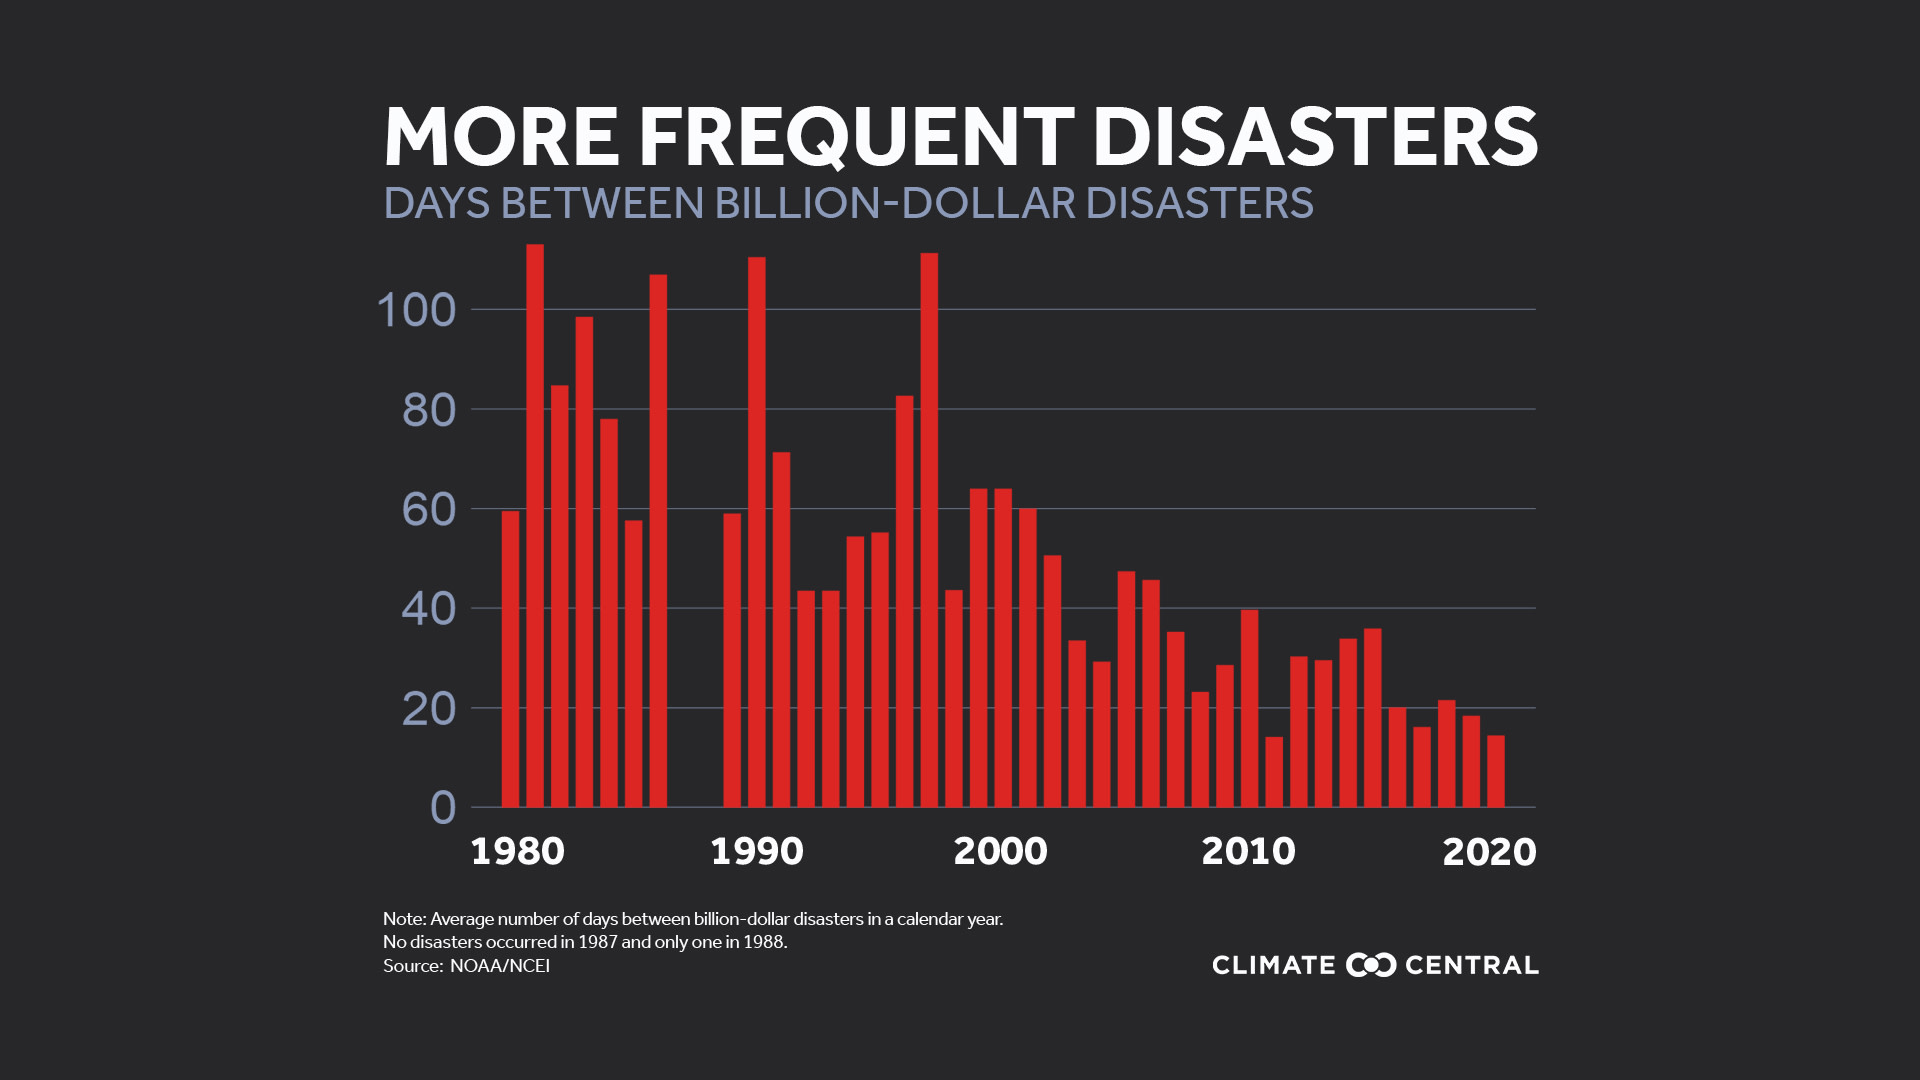
More Disasters, More Often: It's not just the total number of disasters—but how often they happen—that strains the resources available for communities to manage risks and recover quickly.
Between 1980-2020, the time between billion-dollar disasters in a calendar year has steadily dropped, according to new analysis by Climate Central, with as little as two weeks on average between disasters in 2020.
The average time between billion-dollar disasters—time to help communities across the nation recover—has dropped from 82 days in the 1980s to 26 days in the 2010s. In the last five years (2016-2020), there have been just 18 days on average between billion-dollar disasters.
Less time between disasters can mean less time and resources available to respond, recover and prepare for future events.
Globally, the highest costs have resulted when multiple events occur in the same region and season—as in the Atlantic hurricane seasons of 2005 and 2017 (Raymond et al., 2020). According to NOAA, these two seasons resulted in more than 5,000 U.S. lives lost and over $520 billion in combined economic losses from billion-dollar tropical cyclones.
Billion-Dollar Disasters in a Warmer World: According to the latest IPCC report, it is an “established fact” that human-caused greenhouse gas emissions have “led to an increased frequency and/or intensity of some weather and climate extremes since pre-industrial times.”
The report concludes that the intensity and frequency of extreme heat, heavy rainfall, and the proportion of major tropical cyclones have increased globally based on observations—trends that are projected to continue with additional warming.
The increase we’ve already seen in U.S. billion-dollar disasters reflects approximately 1.1 °C (2.0°F) of warming to date since the industrial revolution (1850-1900). And we can expect more warming in the coming decades.
The latest IPCC report estimates that, without rapid emissions cuts, the target set in the Paris Agreement of 1.5 °C (2.7°F) warming by 2100 is very likely to be exceeded by the mid-2040s at the latest. Exactly when these targets could be exceeded (and by how much) depends on the speed and scale of global climate action.
Without more ambitious emissions cuts that align with the Paris Agreement targets (which countries are being asked to commit to at the United Nations Climate Change Conference (COP26) in November), we can expect even more frequent and intense billion-dollar disasters in the future.
What climate risks could we face if we fail to cut emissions? This interactive web app, created by Camilo Mora and colleagues, allows users to explore the cumulative impact of 11 different climate hazards at any location across a range of future emissions scenarios.
POTENTIAL LOCAL STORY ANGLES
What’s the cost of billion-dollar disasters in your local area?
Billion-dollar disasters have impacted all 50 states, the Virgin Islands and Puerto Rico. The NOAA/NCEI website includes interactive tools for visualizing and summarizing billion-dollar disaster statistics. These tools can quickly identify the most costly and frequent types of disasters in your state or region for any time period from 1980-2021.
Not all disasters are billion-dollar disasters.
FEMA maintains a nationwide database of all disaster declarations and public assistance that is searchable by state or zip code. You can also search for current and historical National Flood and Insurance Program (NFIP) policy and claims statistics by state or county.
Is your county or city prepared for these events?
Local officials and state emergency management agencies can provide information about official disaster planning, emergency response, and available state-funded and federal disaster assistance programs. Community leaders, first responders, and disaster relief organizations such as the Red Cross can provide insight on local impacts and needs.
What are the long-term impacts of disasters?
Disaster recovery can take years, and extends far beyond economic losses. Physical and behavioral health impacts can last long after the national news has stopped paying attention. If your region has experienced a disaster in the last five years, check in on the affected community to understand their experience, whether they’ve received assistance, and whether they feel prepared for future disasters. Disasters disproportionately impact individuals living in poverty. This interactive map allows users to search and explore the CDC’s Social Vulnerability Index by county.
Tools for reporting on extreme weather events and disasters near you:
Journalism schools and organizations provide advice for responsibly reporting on disasters, including focusing on safety, data, and cultural sensitivity. The Pulitzer Center on Crisis Reporting provides support for climate change reporting. The Donald W. Reynolds Journalism Institute at the University of Missouri has created a reporters’ guide to climate adaptation. Climate Central’s Extreme Weather Toolkit provides more information about extreme weather and its connection to climate change.
LOCAL EXPERTS
The U.S. Climate Resilience Toolkit includes a searchable map to identify regional and local climate resilience expertise. The SciLine service, 500 Women Scientists or the press offices of local universities may be able to connect you with local scientists who have expertise on extreme events and climate change. Academic resources include: Columbia University’s Initiative on Extreme Weather and Climate; Florida International University Extreme Events Institute; and National Academy of Sciences Resilient America Program. The American Association of State Climatologists is a professional scientific organization composed of all state climatologists.
NATIONAL EXPERTS
Dr. Adam Smith (NOAA)
Applied Climatologist, Center for Weather and Climate, National Centers for Environmental Information (NCEI). Lead scientist for NOAA’s U.S. Billion-dollar Weather and Climate Disasters research, analysis and public/private data partnerships (www.ncdc.noaa.gov/billions).
Adam.Smith@noaa.govDr. Camilo Mora
Professor
Department of Geography and Environment, The University of Hawaiʻi
cmora@hawaii.edu
Dr. Mora’s expertise includes climate hazards under future emissions scenarios (see related paper and interactive tool).
*Available for interviews in English and Spanish
METHODOLOGY
The time between billion-dollar disasters was calculated by measuring the time between the start date of each disaster as recorded by NOAA/NCEI. The difference in days was only for calendar year events, with the first event of the calendar year set as the first date. For this reason there are no data points for 1987 and 1988, which had zero events and only one event, respectively.