Climate Matters•May 6, 2020
CO2 and the Climate Curve

KEY CONCEPTS
Bending the climate curve won’t be easy. Even with temporarily lower emissions during the pandemic, greenhouse gas concentrations continue to rise. That’s because Earth is like a plugged-up bathtub—slowing the flow doesn’t mean the tub will stop filling.
Air quality is a different story; CO2 stays in the atmosphere for hundreds to thousands of years, while other air pollutants are gone much sooner. We’ll discuss this in a future release.
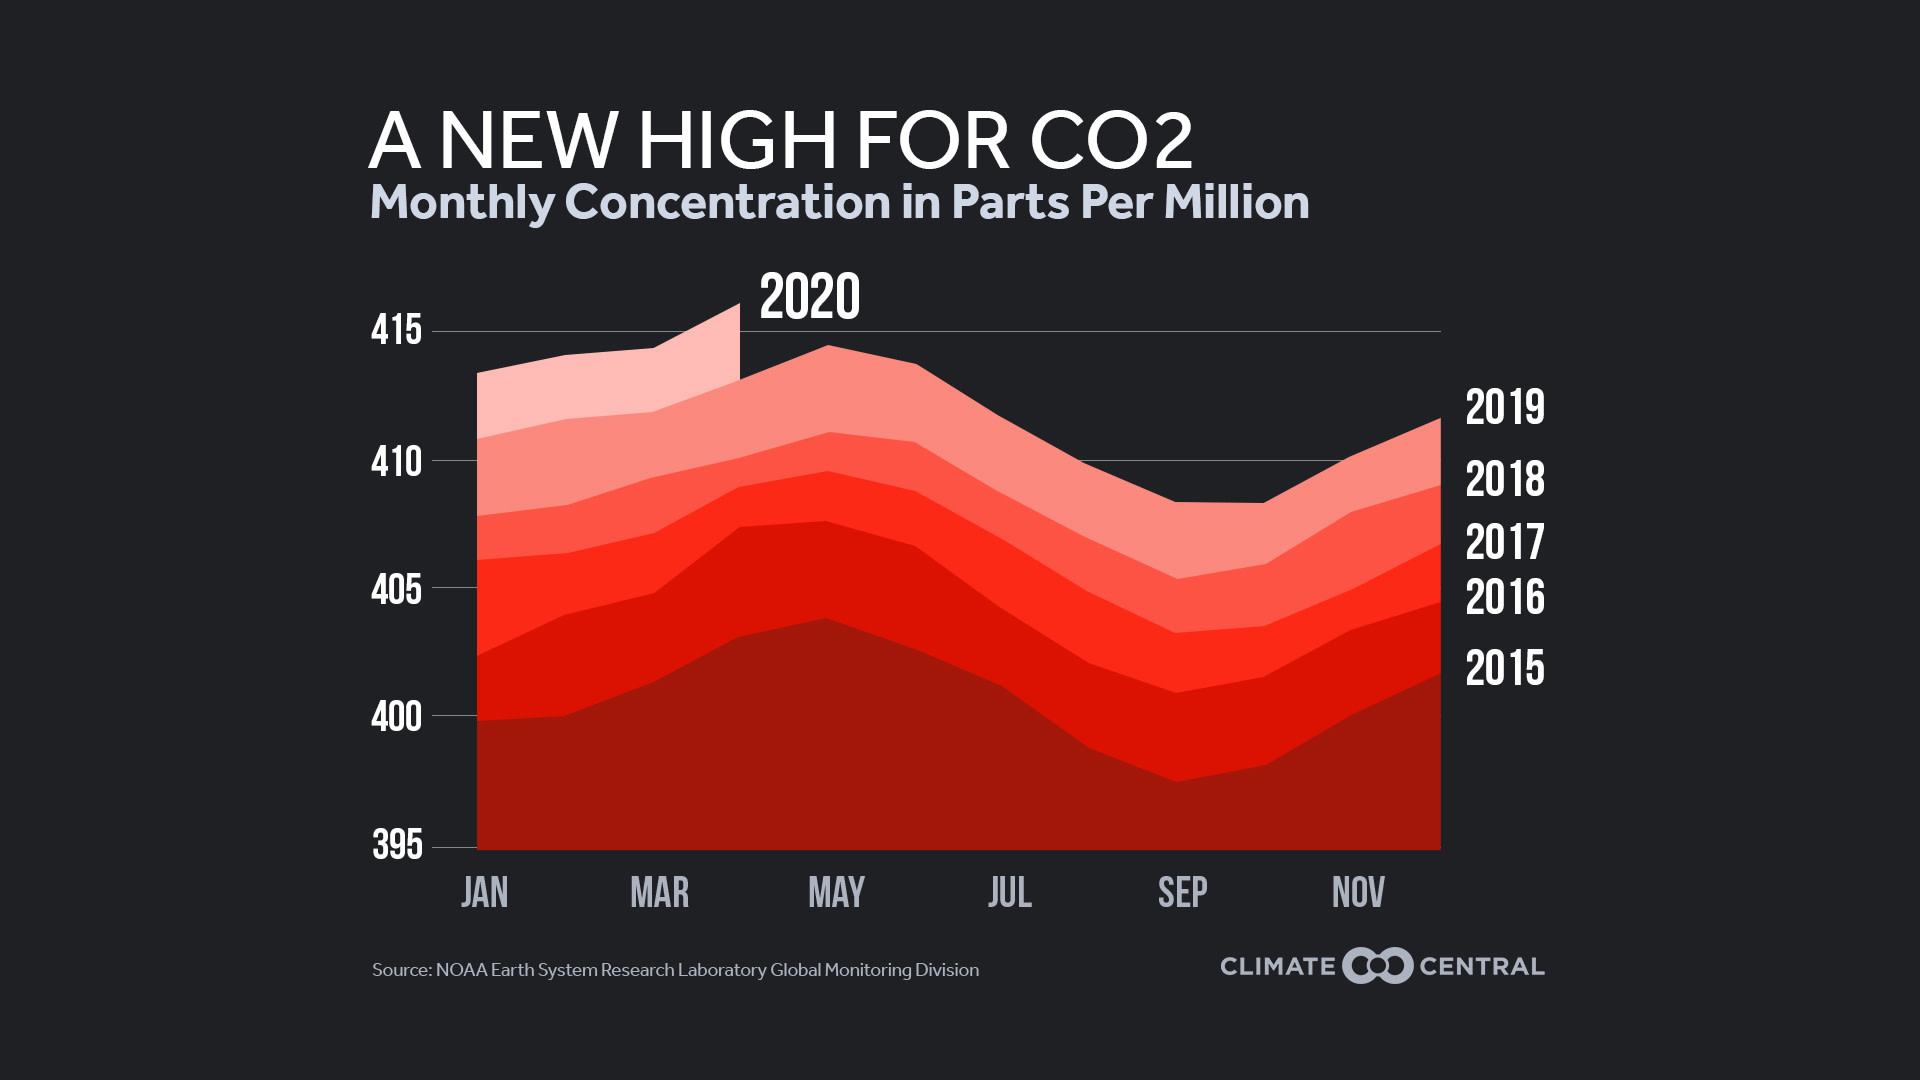
CO2 levels peak annually every May, as plants in the Northern Hemisphere use CO2 to grow. Once again, this year’s peak will be the highest in human history.
In the first three months of 2020, global temperatures were nearly 1.5°C (2.7°F) above a preindustrial baseline. That’s the second-warmest on record, and close to the “stretch” goal of the Paris Climate Agreement.
READY-TO-USE GRAPHICS
Bending the climate curve won’t be easy. Even with global lockdowns, atmospheric carbon dioxide (CO2) is set to reach its highest level in three million years. Annual emissions of CO2 may fall as much as 8% this year—six times more than they did during the 2008 financial crisis. But this is not a sustainable way to reduce emissions. And as experts from NOAA and Scripps explain, the current drop in emissions has had no visible effect on the overall concentration thus far.
That’s why curbing climate change is such a challenge. Since CO2 stays in the atmosphere for hundreds to thousands of years, net emissions must drop to zero before the concentration will stabilize. If the atmosphere is a plugged-up bathtub, slowing the tap (emissions) doesn’t mean the tub (concentration) will stop filling.
CO2 varies seasonally; the global concentration peaks in May as the Northern Hemisphere’s plants accelerate their use of CO2 to grow. Still, the year-to-year increase is unmistakable—with last month’s peak above 416 ppm. The last time CO2 levels were that high, trees grew near the South Pole and sea levels were 50 to 80 feet higher than today.
It’s not just CO2. Last year, other key greenhouse gases like methane and nitrous oxide also reached record-high modern concentrations. Methane levels are nearly triple the preindustrial amount—a rise that may account for 17% of global warming since then (vs. 66% from CO2). Though methane has a much shorter lifetime in the atmosphere, its heat-trapping potential is 28 times greater than the equivalent CO2 over 100 years. And according to recent research, methane emissions from America’s largest oilfield may be double that of previous estimates.
More heat-trapping gases lead to higher temperatures, bringing the climate change impacts that are affecting us here and now. So far, this year is the world’s second hottest on record—with 2020’s global temperatures nearly 1.5°C (2.7°F) above a preindustrial baseline. While temperatures do vary a bit year-to-year, consistent warming above 1.5°C would bring even greater damage to food and water supplies, coral reefs, and more. Flattening this curve may be the greatest challenge of our time, but solutions do exist. From renewable energy to smarter agriculture to education, major actions today can lower the CO2 levels of the future.
Note: As recent events make clear, air quality is a different story—since most air pollutants come and go much quicker than CO2. We’ll cover this more in the coming weeks.
EXPERTS TO INTERVIEW
Pieter Tans, Chief Scientist, Global Monitoring Laboratory, NOAA Global Greenhouse Gas Reference Network, Pieter.Tans@noaa.gov
Ralph Keeling, Director, Scripps CO2 Program, rkeeling@ucsd.edu
Ahira Sánchez-Lugo, Physical Scientist, NOAA National Centers for Environmental Information (NCEI), Center for Weather and Climate (CWC), Ahira.Sanchez-Lugo@noaa.gov
*Available for interviews in Spanish and English
Derek “Deke” Arndt, Chief, Climate Monitoring Branch, NOAA National Centers for Environmental Information (NCEI), Derek.Arndt@noaa.gov
METHODOLOGY
CO2 data from Mauna Loa, Hawaii is reported by NOAA’s Earth System Research Laboratory Global Monitoring Division. Calculations of average annual global temperature are performed independently at NASA and NOAA (among other groups). Climate Central combines these and compares temperatures to an earlier 1880-1910 baseline to assess warming closer to the preindustrial era.