Climate Matters•May 11, 2022
Changing Thunderstorm Potential
KEY CONCEPTS
Severe weather —thunderstorms that produce tornadoes, damaging wind, and/or hail—account for nearly half of all billion-dollar weather disasters in the U.S. since 1980.
This week, we look at how one key indicator of thunderstorm severity—Convective Available Potential Energy (CAPE)—has changed with recent warming.
CAPE values generally peak during warmer months in the eastern U.S. But since 1979, parts of the eastern U.S. have seen up to 10-15 more days of high CAPE values during both spring and summer—prime time for thunderstorms.
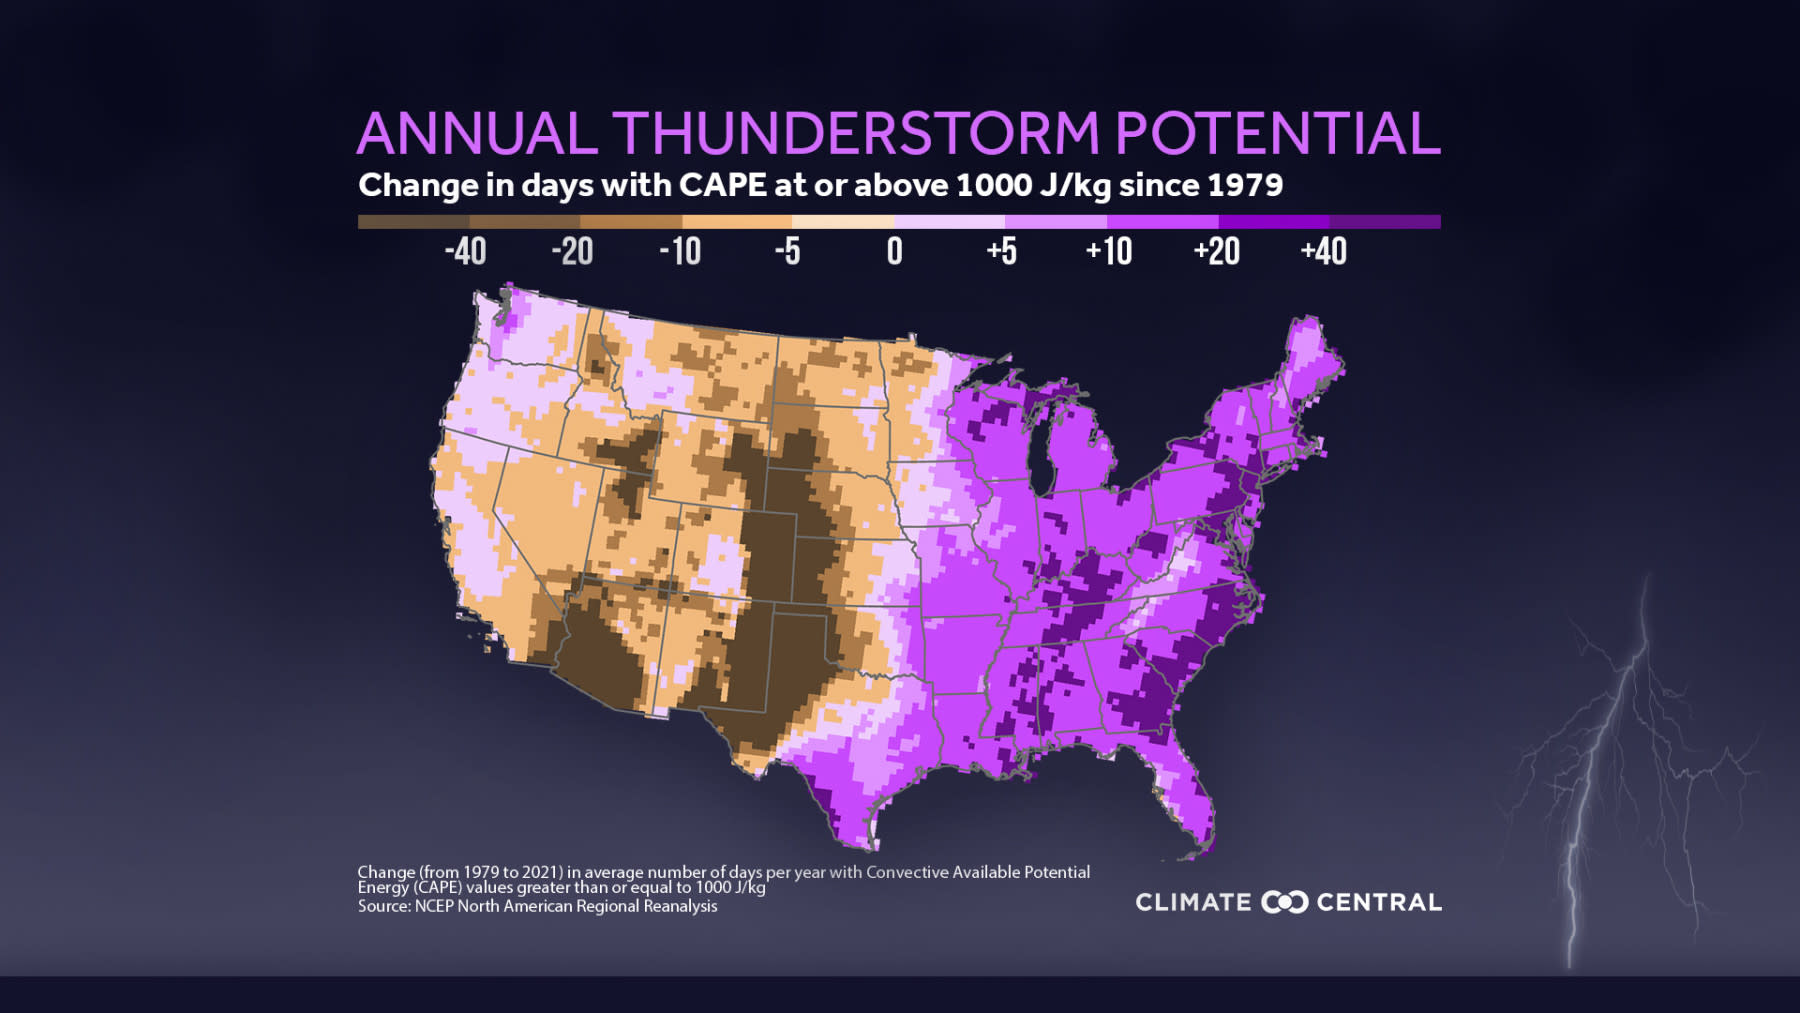
On an annual basis, higher-CAPE days have become more frequent in the eastern U.S. and less frequent in the west.
Severe weather is complicated. CAPE is just one ingredient in the severe weather recipe, and it’s unclear how other ingredients could respond to additional warming.
Severe weather —thunderstorms which include tornadoes,damaging wind, and/or hail—account for nearly half (47%) of the 323 billion-dollar weather disasters that have impacted the U.S. since 1980. This week, we look at how one key indicator of thunderstorm severity—Convective Available Potential Energy (CAPE)—has changed with recent warming.
Thunderstorm severity is a sliding scale. Warm, rising air is central to the formation of thunderstorms. The amount of energy available for this rising air is called convective available potential energy (CAPE).
Higher CAPE values mean more energy available to move throughout the atmosphere, and thus greater potential for thunderstorms.
CAPE values vary by season and region, but there is no absolute threshold above which a thunderstorm is considered severe. Thunderstorms often have CAPE values of 1,000 J/kg or higher, and values greater than 4,000 J/kg represent extreme atmospheric instability.
Whether a certain CAPE value is likely to fuel severe weather depends on how much higher it is than typical CAPE values for that location and time of year.
Severe thunderstorm potential is highest in spring—and getting higher. To understand how thunderstorm potential has changed with rising temperatures, Climate Central analyzed trends in CAPE values across the U.S. from 1979 to 2021.
Thunderstorm potential depends on the season. The highest CAPE values generally occur between April and September each year—the same months that have historically seen the most frequent, costly, and deadly impacts from severe storms in the U.S.
CAPE values have increased the most during spring and summer. Spring has experienced the largest increases, with 10-15 more days with CAPE values above 1,000 J/kg since 1979 in parts of the Ohio Valley (central) region—and hotspots in Kentucky and Tennessee. During summer, parts of the Northeast have seen 10-15 or more days with CAPE values above 1,000 J/kg since 1979.
The (convective) continental divide. Whether thunderstorm potential has been increasing or decreasing since 1979 depends on which half of the country you’re in.
The western U.S. has seen fewer springtime high CAPE days since 1979, especially in the lower Great Plains.
The eastern U.S. has seen more springtime high CAPE days since 1979, especially in the Midwest and the Eastern Seaboard.
Looking at the potential for even more severe storms (where CAPE ≥ 2,000 J/kg) across all seasons, the country remains split.
Severe weather and the climate connection. Assessing how climate change impacts severe weather is challenging because severe storms are complex, local, and short-lived.
CAPE quantifies air instability, just one of several important factors in severe weather formation.
Tornadoes also need spin. It’s unclear how the wind shear that generates tornado spin responds to rising temperatures.
Still, the number of tornadoes in large outbreaks, and the frequency of storm-producing weather conditions, is trending upwards.
POTENTIAL LOCAL STORY ANGLES
What does severe weather look like near you?
NOAA’s Storm Prediction Center has local thunderstorm forecast, tornado watch, and convection mapping tools. They also have an interactive map of severe weather data dating back to 1992. For immediate severe weather watch, see the National Weather Service’s customizable severe weather monitor.
How is severe weather impacting your community?
Thunderstorms are a common weather-related cause of power outages; if thunderstorms go up, outages go up. Outage risk is local and depends on transmission line integrity, utility company practices, etc. Track power outages across the country, and get to know your local energy infrastructure. Additionally, compound extreme events are projected to become more frequent. This complicates risk and decision-making during disaster; for example one may need to choose whether to shelter in the basement or attic during a concurrent thunderstorm-tornado. Severe weather may lead to businesses shutdown, infrastructure damage, and road closures which can be monitored through the National Weather Service tool.
LOCAL EXPERTS
The SciLine service, 500 Women Scientists or the press offices of local universities may be able to connect you with local scientists who have expertise on severe weather and climate change. The American Association of State Climatologists is a professional scientific organization composed of all state climatologists.
NATIONAL EXPERTS
Harold Brooks, PhD
Senior scientist,
NOAA National Severe Storms Laboratory
harold.brooks@noaa.gov
Expertise: severe weather scienceRichard Rood, PhD
Professor, Department of Climate and Space Sciences and Engineering and
The School of Environment and Sustainability,
University of Michigan
rbrood@umich.edu
Expertise: human impacts, adaptation, modeling, climate change & severe weatherRobert Trapp, PhD
Head, Professor of Atmospheric Sciences
University of Illinois Urbana-Champaign
jtrapp@illinois.edu
Expertise: severe weather science
METHODOLOGY
Daily maximum convective available potential energy (CAPE) from 1979-2021 was calculated for the contiguous United States using data from the North American Regional Reanalysis. The number of days CAPE met or exceeded 1,000 J/kg (generally considered the lower threshold for severe storms) was calculated for each season and summed to calculate the annual total. Linear regression analysis was used to calculate an estimate of total change.