Climate Matters•February 16, 2022
Changing precipitation normals
KEY CONCEPTS
Climate normals are 30-year averages of weather data that provide a baseline for comparing current conditions in each season and region of the country.
Here, we look at the change in average precipitation between the 1991-2020 and 1981-2010 normal periods.
Annual average precipitation has increased east of the Rockies and decreased to the west, especially in the Southwestern U.S.
Seasonal averages show high regional variation, with a strong winter wetting signal in the North Central U.S., and strong summer and fall drying signals throughout the West, Southwest and Northwestern U.S.
Local changes in precipitation between the old and new normal periods were assessed using station data for 247 locations across the U.S.

Change in Local Precipitation Normals
U.S. Precipitation Normals
Rainfall is highly variable day-to-day, month-to-month and year-to-year. Climate normals average 30 years of weather data, including precipitation, to determine typical conditions for a particular location and time of year.
NOAA releases a new set of U.S. climate normals each decade, and the 1991–2020 period provides the most recent 30-year baseline for comparing current weather.
We’ve previously covered the change in average temperature between 1991-2020 and the previous 30-year period (1981-2010). Here, we look at the change in average precipitation between these two periods.
Nationwide Change in Precipitation Normals: The percent change in annual average precipitation between the current (1991-2020) and previous (1981-2010) 30-year period is represented here in national maps based on gridded data.
Annual average precipitation has generally increased east of the Rockies and in the North Central U.S., and decreased in the West (especially the Southwest).
Comparing seasonal average precipitation between the 1991-2020 and 1981-2010 periods reflects more of the month-to-month and region-to-region variability across the diverse microclimates of the contiguous U.S.
Average winter precipitation increased for much of the contiguous U.S., especially in the Northern Rockies and Plains and Upper Midwest regions, where some areas were up to 25% wetter during 1991-2020 than during 1981-2010.
Average spring precipitation increased in the Ohio Valley and much of the Southeast, while the Southwest became drier.
Average summer precipitation decreased throughout the West and into the Northwest, while the eastern two-thirds of the U.S. showed a mix of wetter and drier zones east of the Rockies.
Average fall precipitation decreased throughout the Southwest, South Central, and Western regions. Decreases in average fall precipitation between the old and new normal periods exceeded -25% in parts of California.
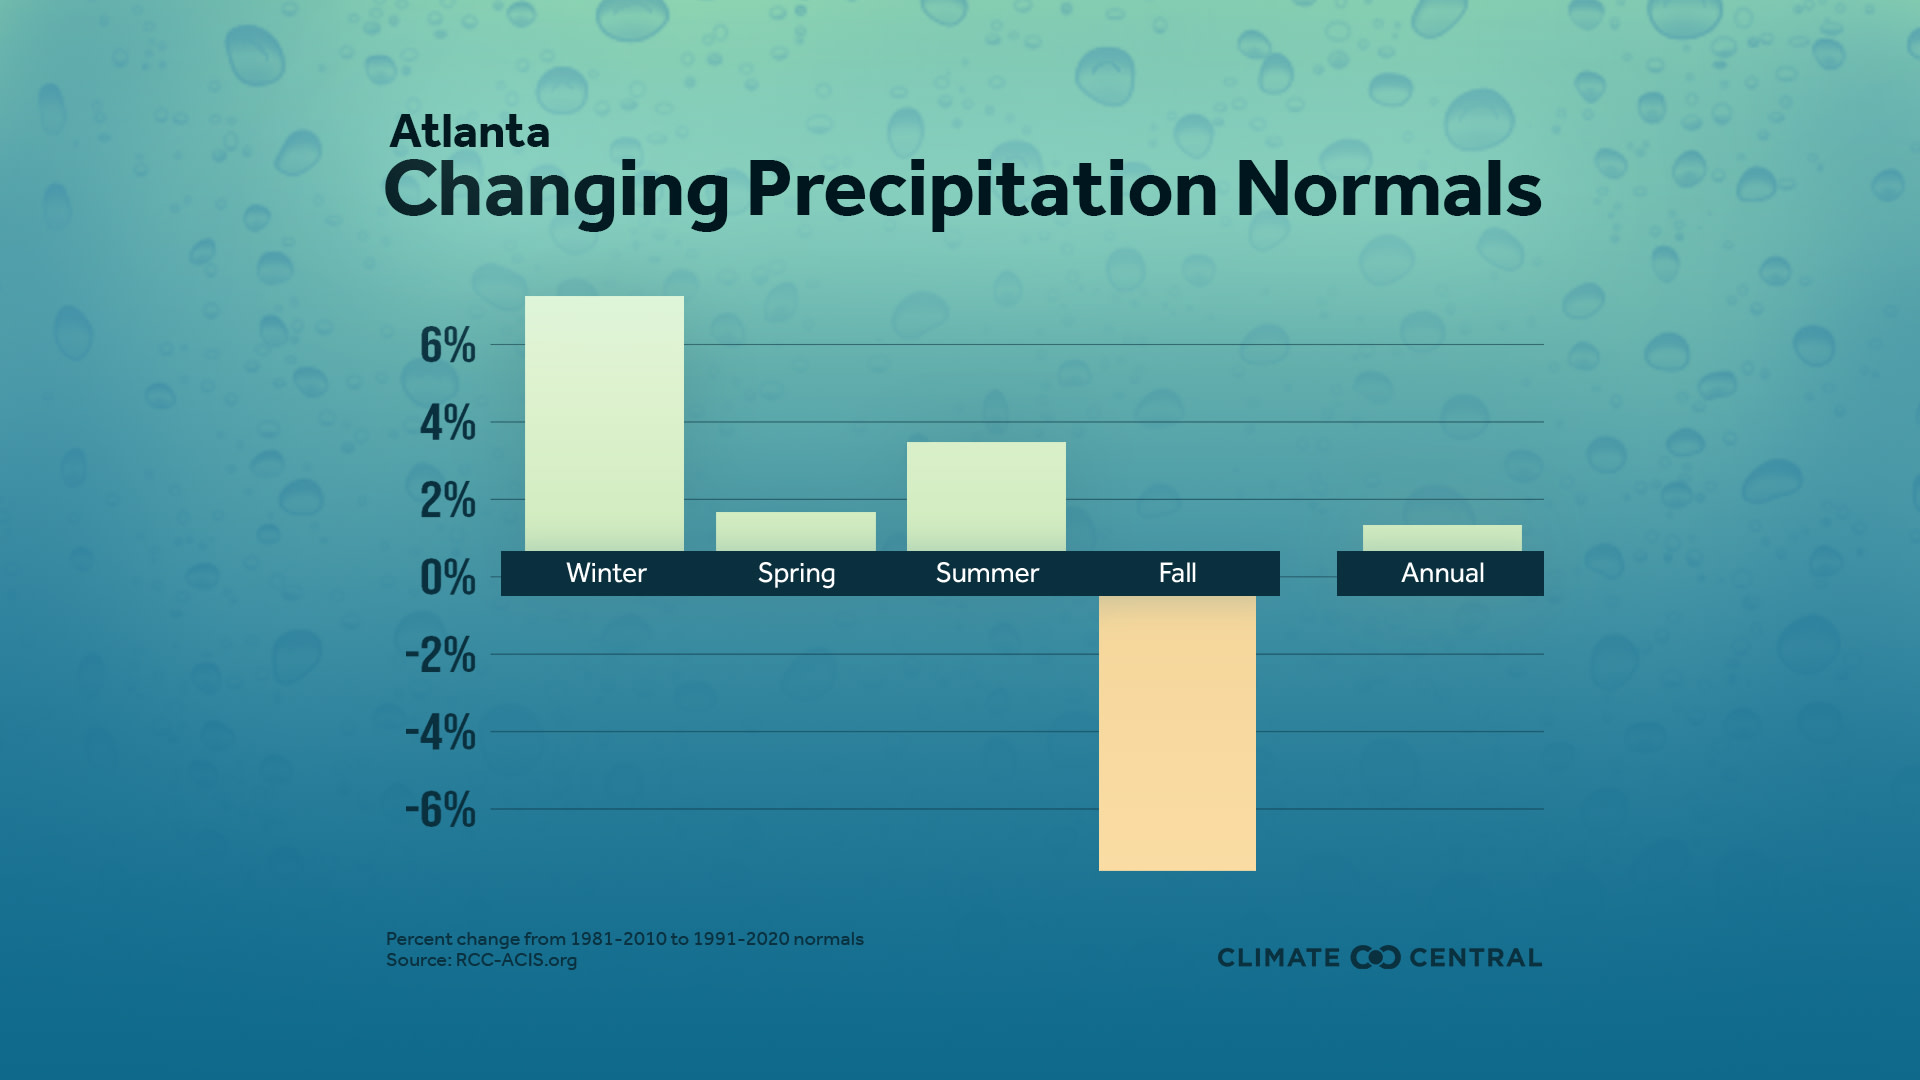
Local Change in Precipitation Normals: For a closer look within each region, Climate Central charted the change in annual and seasonal average precipitation between the 1991-2020 and 1981-2010 periods for 247 locations across the U.S. based on weather station data.
Of the 247 stations in our network, 70% experienced an increase in annual average precipitation. Lexington, Ky. and Atlantic City, N.J. both experienced the largest percent increases in annual average precipitation (+10%). Traverse City, Mich. and Eugene, Ore. experienced the largest percent decreases (-12% and -11%, respectively).
73% of stations saw wetter winters during 1991-2020 than in 1981-2010. The largest percent increase in average winter precipitation was in Mitchell, S.D. (+25%) and the largest percent decrease was in Traverse City, Mich. (-34%).
72% of stations saw wetter springs, with the largest percent increase in Honolulu, Hawaii (+21%) and the largest percent decrease in Tucson, Ariz. (-21%).
64% of stations saw wetter summers, with the largest percent increase in San Jose, Calif. (+156%) and the largest percent decrease in Bakersfield, Calif. (-58%).
Average fall precipitation increased for 45% of stations and decreased for 54%. The largest percent increase in average fall precipitation was in Greenville, N.C. (+17%) and San Jose, Calif. had the largest percent decrease (-33%).
Precipitation Normals and Climate Change:
The two normal periods in this analysis overlap by 20 years and cover a total of just 40 years. Given this limited time window and the highly variable nature of precipitation, it is difficult to link the change in the two most recent precipitation normals to climate change. The seasonal precipitation shifts observed between the two most recent 30-year normals are, however, generally consistent with modeled and theoretical precipitation changes anticipated over the 21st century under climate change. Climate models project a shift toward drier conditions in the southwestern U.S. and wetter winter and spring conditions in the northern U.S.
Comparing precipitation normals since the 1901-1930 period with the 20th century average shows a general shift toward wetter annual conditions overall (despite regional variation including drier conditions in the Southwest), especially during the four most recent normal periods. This general trend toward wetter normals is likely linked in part to warming over the 20th century because warmer temperatures increase evaporation rates over the ocean and land surface, ultimately leading to more precipitation on average.
POTENTIAL LOCAL STORY ANGLES
What do climate normals mean to my community?
Climate normals aren’t just used to describe weather—they’re used to inform decisions across a range of sectors. Consider interviewing professionals from industries that use climate normals, such as: growers, municipal officials, city planners, energy or construction companies, and insurance groups.
Where can I find more information on the new climate normals?
On the NCEI website, NOAA provides national maps for other temperature and precipitation metrics which you can customize by month or season. You can also create local charts, choosing your own parameter and time scale.
LOCAL EXPERTS
The SciLine service, 500 Women Scientists or the press offices of local universities may be able to connect you with local scientists who have expertise on precipitation and climate change. The American Association of State Climatologists is a professional scientific organization composed of all state climatologists.
NATIONAL EXPERTS
Jared Rennie
Research Meteorologist, NOAA's NCEI
(828)-271-4214
jared.rennie@noaa.gov
Expertise: weather and climate monitoring
METHODOLOGY
The change in annual and seasonal precipitation normals (percent change from 1981-2010 to 1991-2020) was calculated for 247 stations using data from the Applied Climate Information System. The national maps showing the change in annual and seasonal precipitation across the contiguous United States were created using data from the NOAA Monthly U.S. Climate Gridded Dataset (NClimGrid).