Climate Matters•June 1, 2021
2021 Summer Package
THIS IS NOT THE MOST RECENT VERSION AVAILABLE. LINK TO THE MOST RECENT VERSION.
KEY CONCEPTS
The first day of meteorological summer (June 1st) is here and so is our summer package. Explore localized summer graphics for over 200 locations in the full release.
Summer is getting hotter thanks to climate change. With an analysis from Climate Central, you can see this overall trend with rising summer averages, warmer summer nights, and an increase in the number of extremely hot days.
Hotter summer temperatures can contribute to several health problems, including poorer air quality, increased incidence of heat stroke and other heat-related illnesses.

The first day of meteorological summer (June 1st) is here, and so is our summer package. This year’s installment includes:
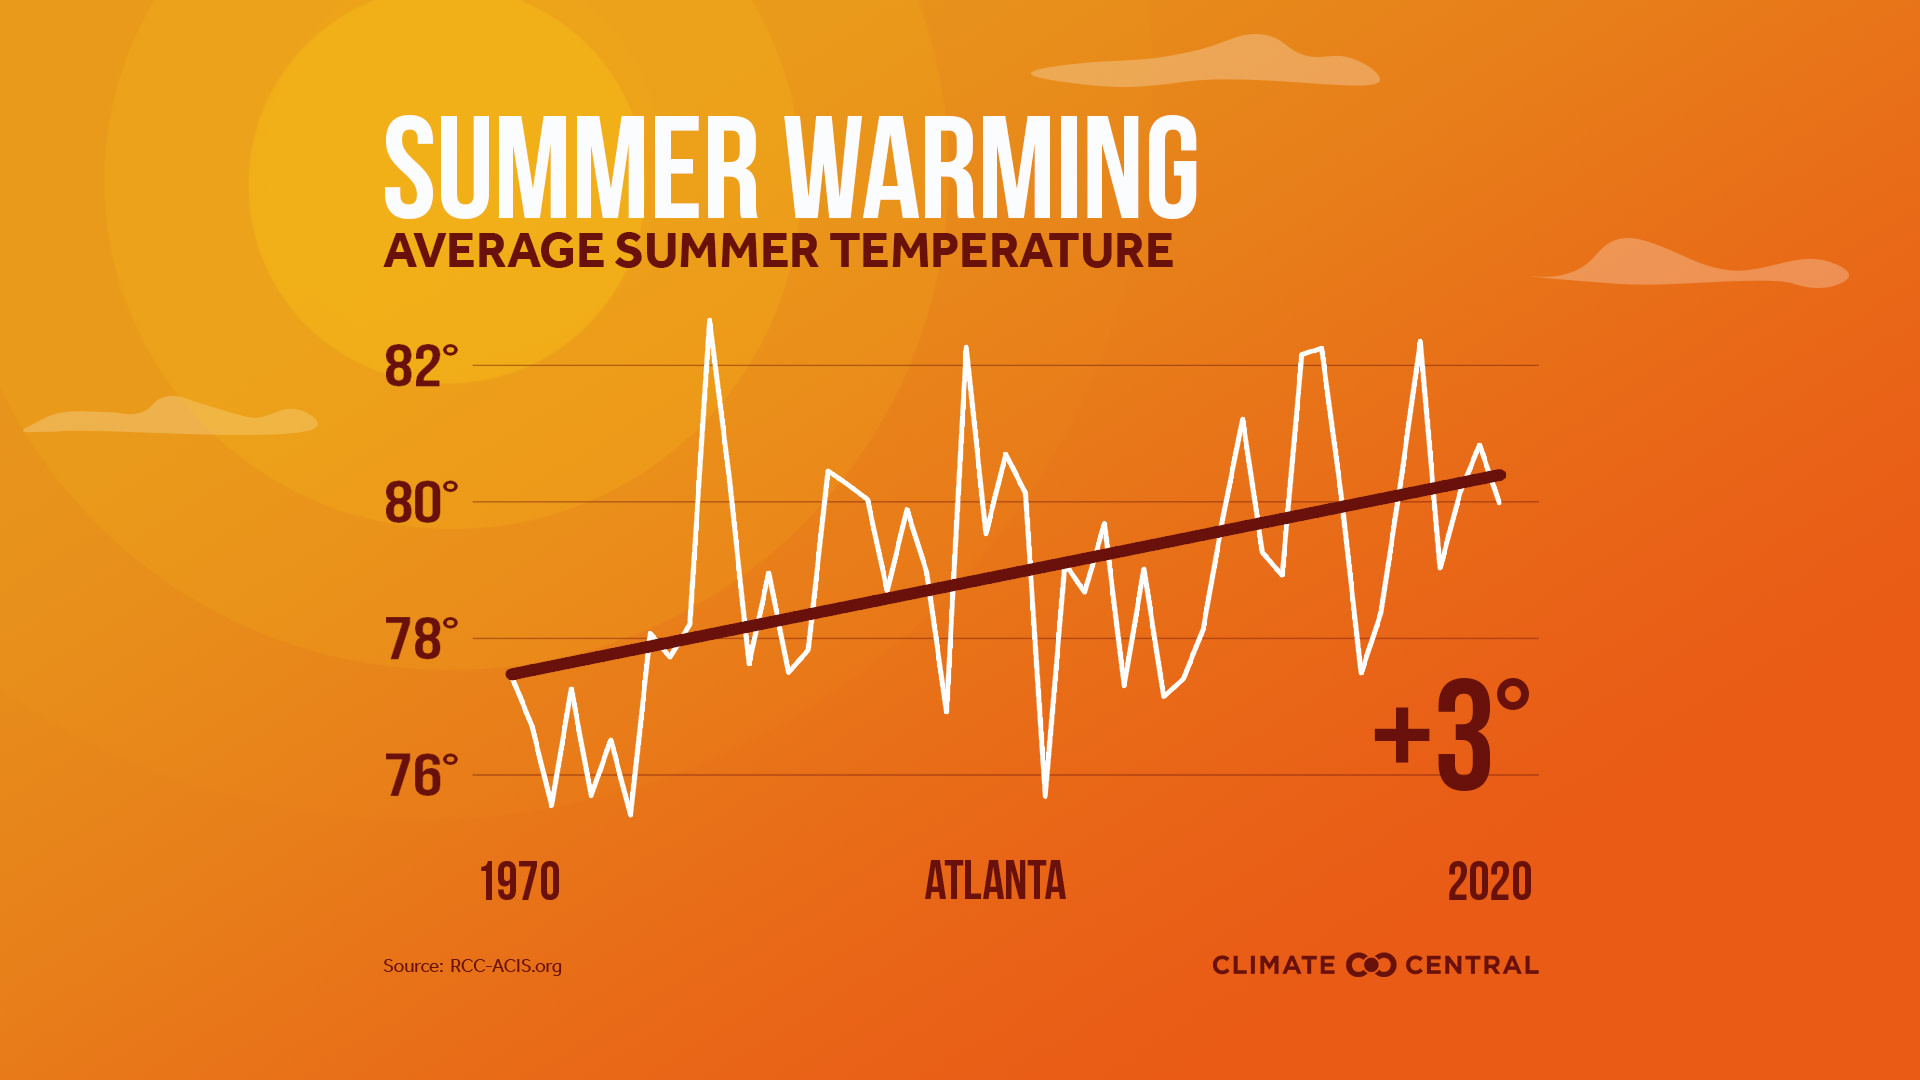
Average Summer Temperatures, local trends and a national map
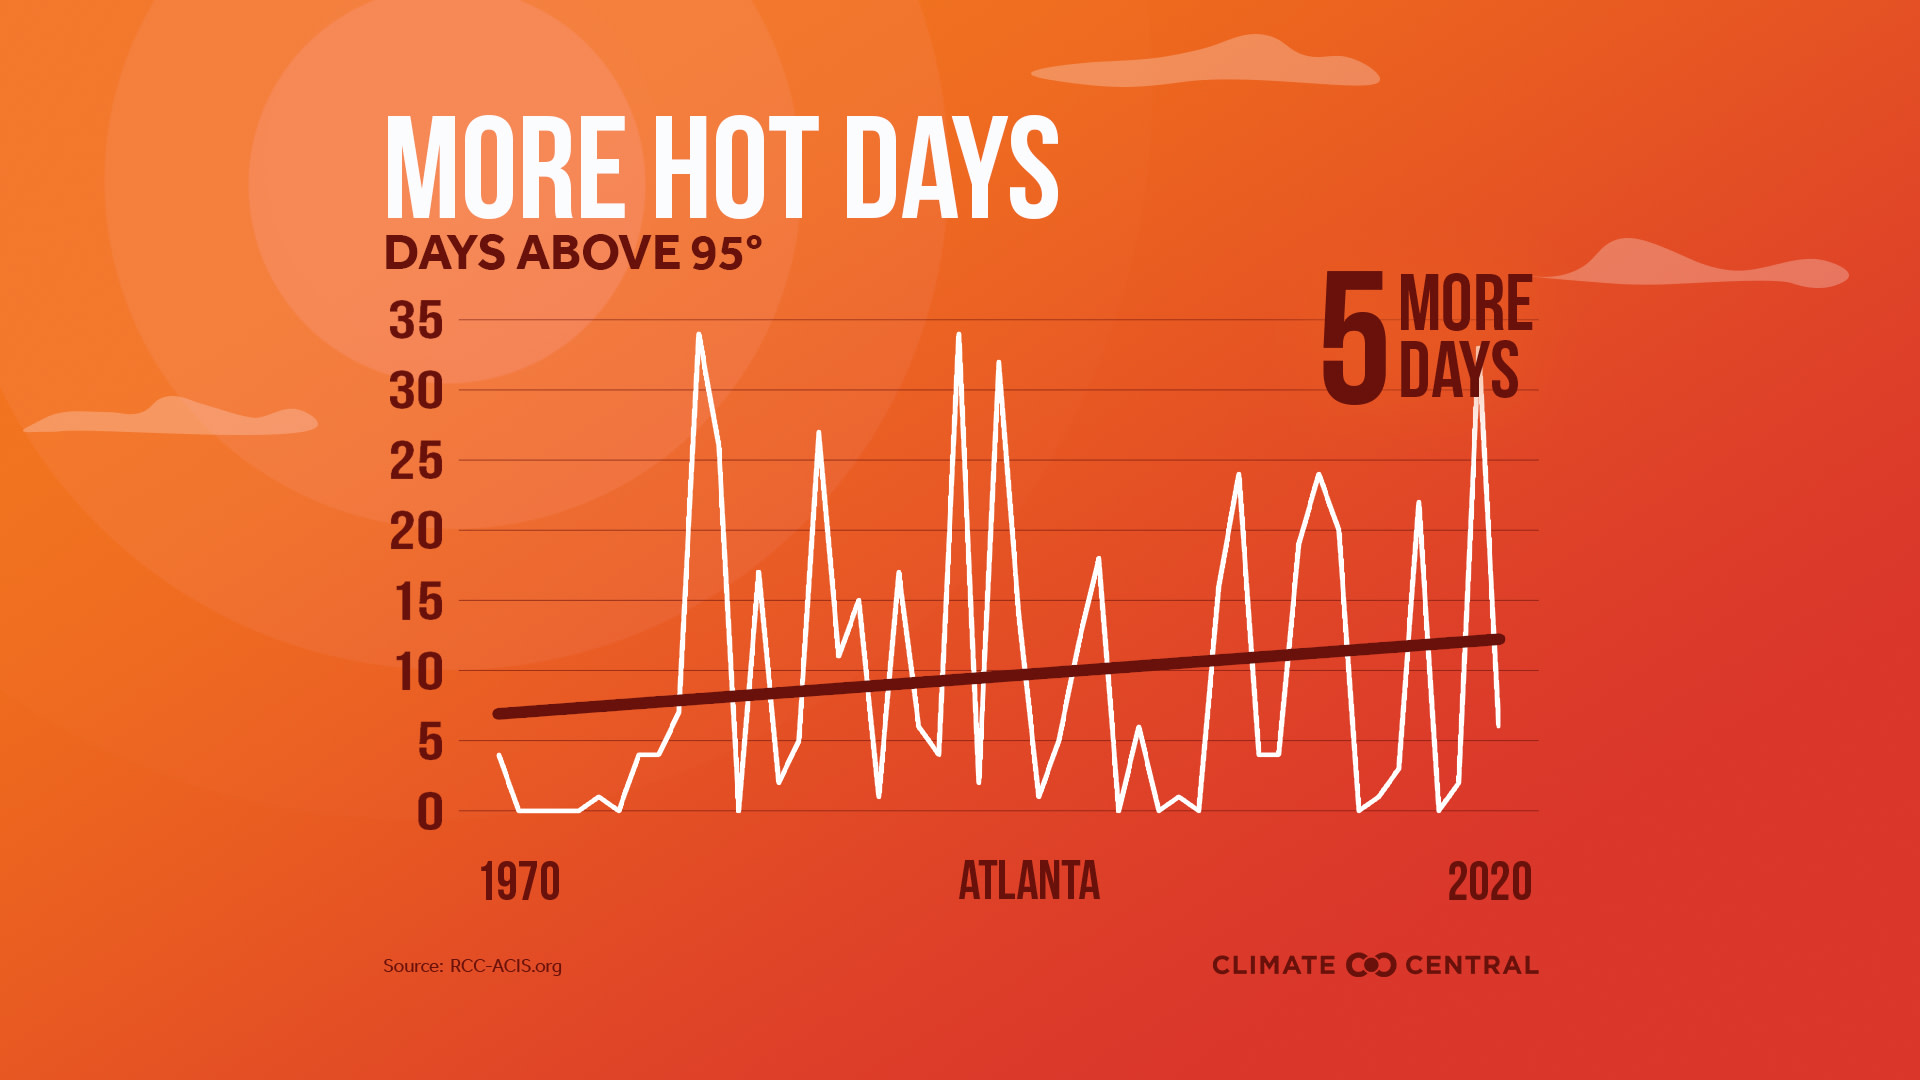
Number of Extremely Hot Days (days above a threshold temperature)
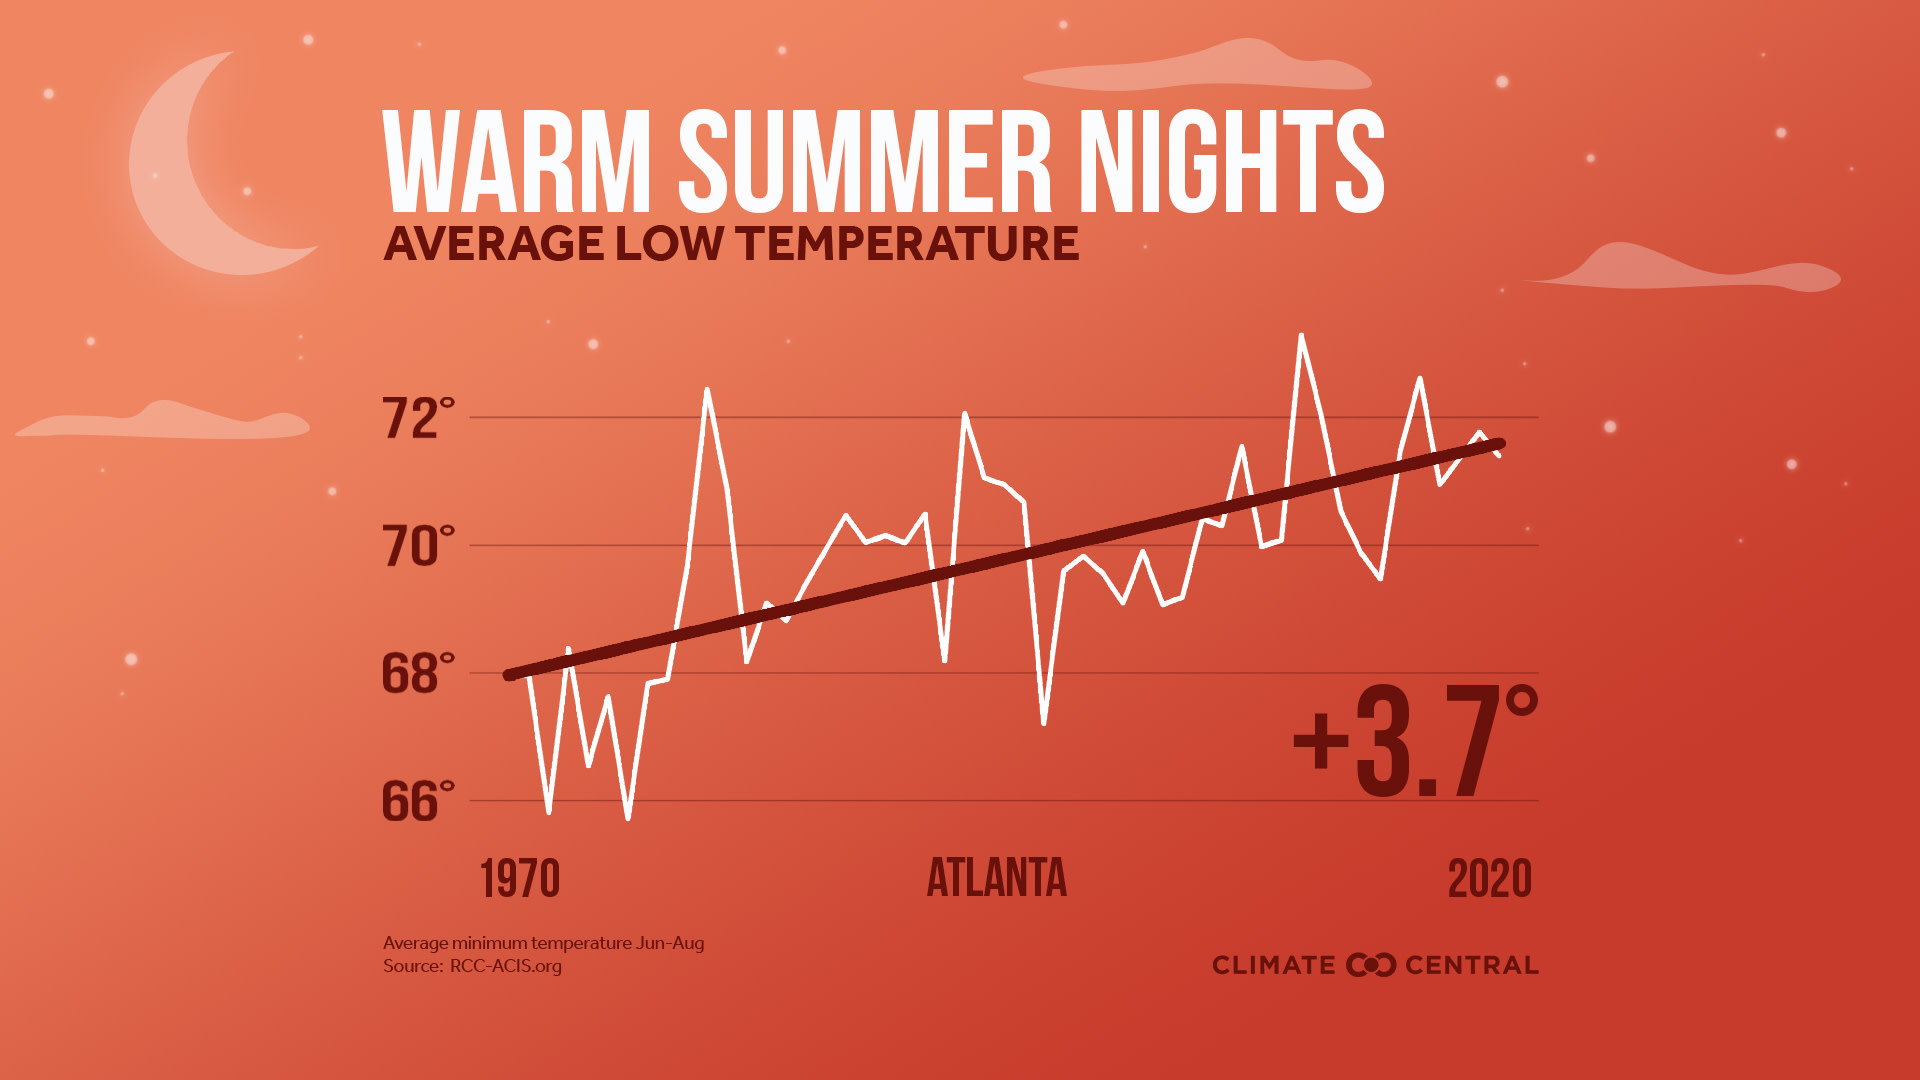
Summer Night Temperatures (average daily minimum temperatures)
Summers are getting hotter thanks to climate change. As heat-trapping greenhouse gases increase the global average temperature, we are experiencing higher average temperatures and more extreme and record-breaking heat events. This is most apparent in the summertime since it's the hottest time of the year.
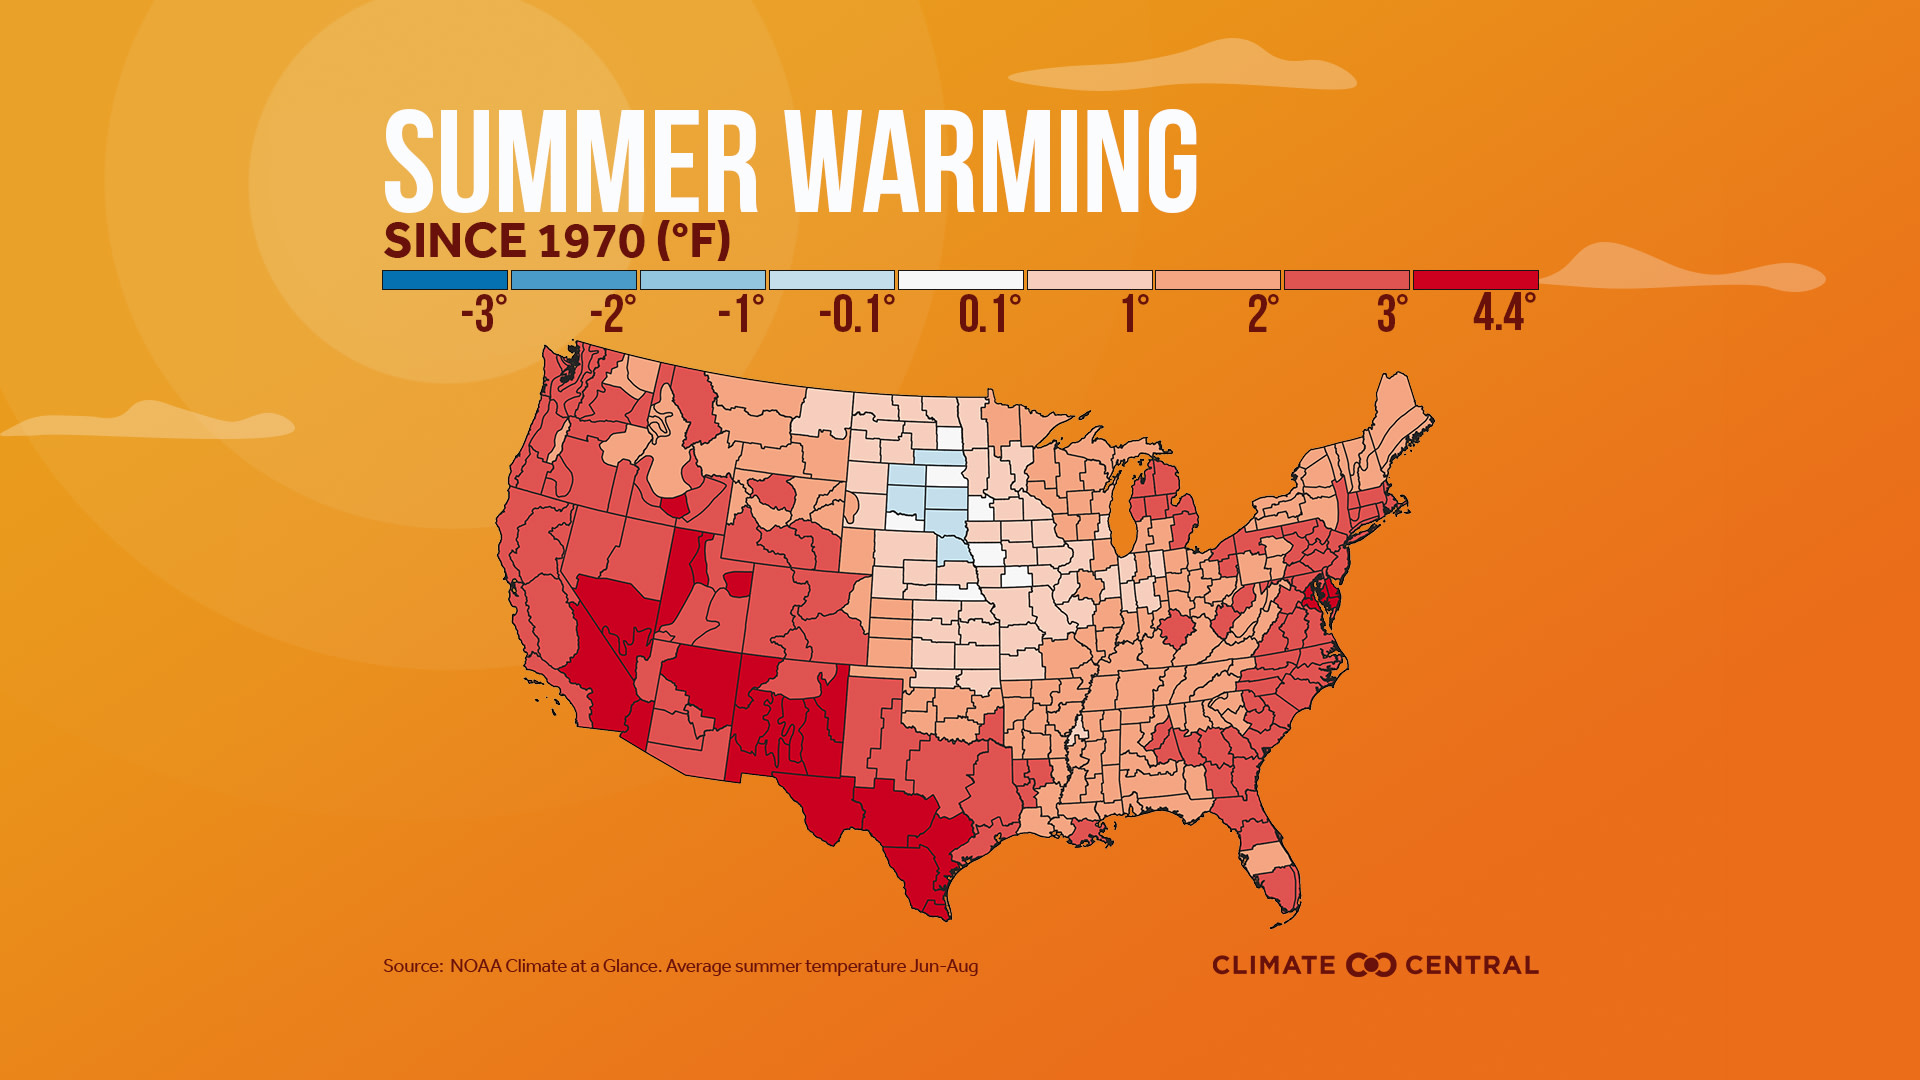
A look at the trends: A Climate Central analysis evaluated 51 years of summer temperature data in 246 U.S. locations. Results show an overall warming trend for the summer season, with:
Rising average temperatures: About 95% (233) of the locations had an increase in their average summer temperature, with 50% (122) of those increasing by 2°F or more.
A fast-warming Western region and Texas: Nine out of the top ten fastest-warming summer locations were located in the Western U.S. and Texas, with Reno, Nev. (10.6°F), Las Vegas (5.6°F), and El Paso, TX (5.5°F) in the lead.
Warmer summer nights: Summer night temperatures increased by 2°F or more in 61% of the locations.
And more extremely hot days: 38% of locations reported, on average, at least one additional week of extremely hot temperatures annually (compared to 1970) and 59% have reported an annual increase of at least three days. The largest change is in Miami with 79 additional days above a sizzling 90°F.
Can humans take the heat? Extreme heat is the deadliest kind of hazardous weather to humans and has many negative consequences to human health:
Extreme heat can increase heat-related illnesses in vulnerable populations. This includes seniors, younger children, and people without air conditioning.
Summer heat can contribute to poor air quality by trapping harmful pollutants close to the Earth’s surface and creating ground-level ozone. These pollutants can inflate respiratory problems in people with asthma and other lung diseases.
In areas without air conditioning, warmer nights can cause health issues by not letting our bodies cool off and recover after intense heat events. One study also reveals that warmer nights can disrupt our sleeping patterns.
Cities can get much hotter than surrounding suburban and rural areas because they have more heat-absorbing surfaces and materials. Studies have found that this "urban heat island" effect disproportionately affects Black and immigrant communities, which typically have less shade-covering trees than whiter areas.
POTENTIAL LOCAL STORY ANGLES
How is heat affecting public health?
The Center for Disease Control (CDC) tracks health and heat data through its public health tracking network for 25 states and New York City. Summer heat and sun can also cause air stagnation, leading to an accumulation of ground-level ozone. Find out more about climate change and air quality from the American Lung Association, and check out their rankings of cleanest cities.
What work is being done to protect vulnerable populations?
Check out resources like the EPA guidebook for excessive-heat response, stories and projects from ISeeChange, and example strategies from the National Integrated Heat Health Information System.
Check out Solutions Journalism to read what your peers are reporting about heat, nearby and around the world:
Solutions Journalism Network is a non-profit organization that trains and supports journalists to report on how people are responding to the world’s largest social issues through rigorous evidence-based reporting. Use the Solutions Story Tracker to discover the different solutions stories related to heat.
LOCAL EXPERTS
The National Weather Service (NWS) operates 122 local weather forecast offices across the country. Check in with the NWS office in your area to find out about any upcoming heat forecasts, heat advisories and excessive heat warnings. Find out what steps are being taken in your locality to beat the heat—ask local officials about your city’s heat response plan, and see if the EPA database on community responses to urban heat islands includes your area.
The SciLine service, 500 Women Scientists or the press offices of local universities may be able to connect you with local scientists who have expertise on carbon emissions in your area. In addition, the American Association of State Climatologists is a professional scientific organization composed of all 50 state climatologists.
NATIONAL EXPERTS
Victor Murphy, NWS Southern Region Climate Service Program Manager
Available for interviews in Spanish and English
Contact: victor.murphy@noaa.govLinda Rudolph, MD, MPH, Principal Investigator
Center for Climate Change and Health, Public Health Institute
Contact: linda.rudolph@phi.org
METHODOLOGY
Summer (June, July, and August) temperature data from 1970-2020 were obtained from the Applied Climate Information System. Displayed trend lines are based on a mathematical linear regression. Climate Central's local analyses include 247 stations. However, for data summaries based on linear trends, only 246 stations are included due to large data gaps in Wheeling, W. Va.