Climate Matters•February 24, 2021
2021 Spring Package
THIS IS NOT THE MOST RECENT VERSION AVAILABLE. LINK TO THE MOST RECENT VERSION.
KEY CONCEPTS
Ready or not, next week brings us the first day of March and the beginning of meteorological spring. In our analysis of 243 cities across the U.S., 120 cities (49%) have recorded an increase in average spring temperatures of 2℉ or more over the past fifty years. Further, 96% of cities (234) reported an increase in the number of above-normal spring days since 1970, with 81% of cities (196) reporting an increase of 5 days or more.
Warming spring temperatures follow a pattern of warmer seasons encroaching on the cold of winter—resulting in an earlier advent of spring and throwing timing of natural events into misalignment. For instance, earlier snowmelt can result in changes in water availability and challenges to the breeding of native fish. Earlier spring temperatures can also lengthen the growing season, supporting longer pollen allergy seasons that start earlier and stick around for longer.

In anticipation of spring—the retreat of snow, blooming of flowers and warming temperatures—we’ve bundled together your favorite seasonal trends. They are:
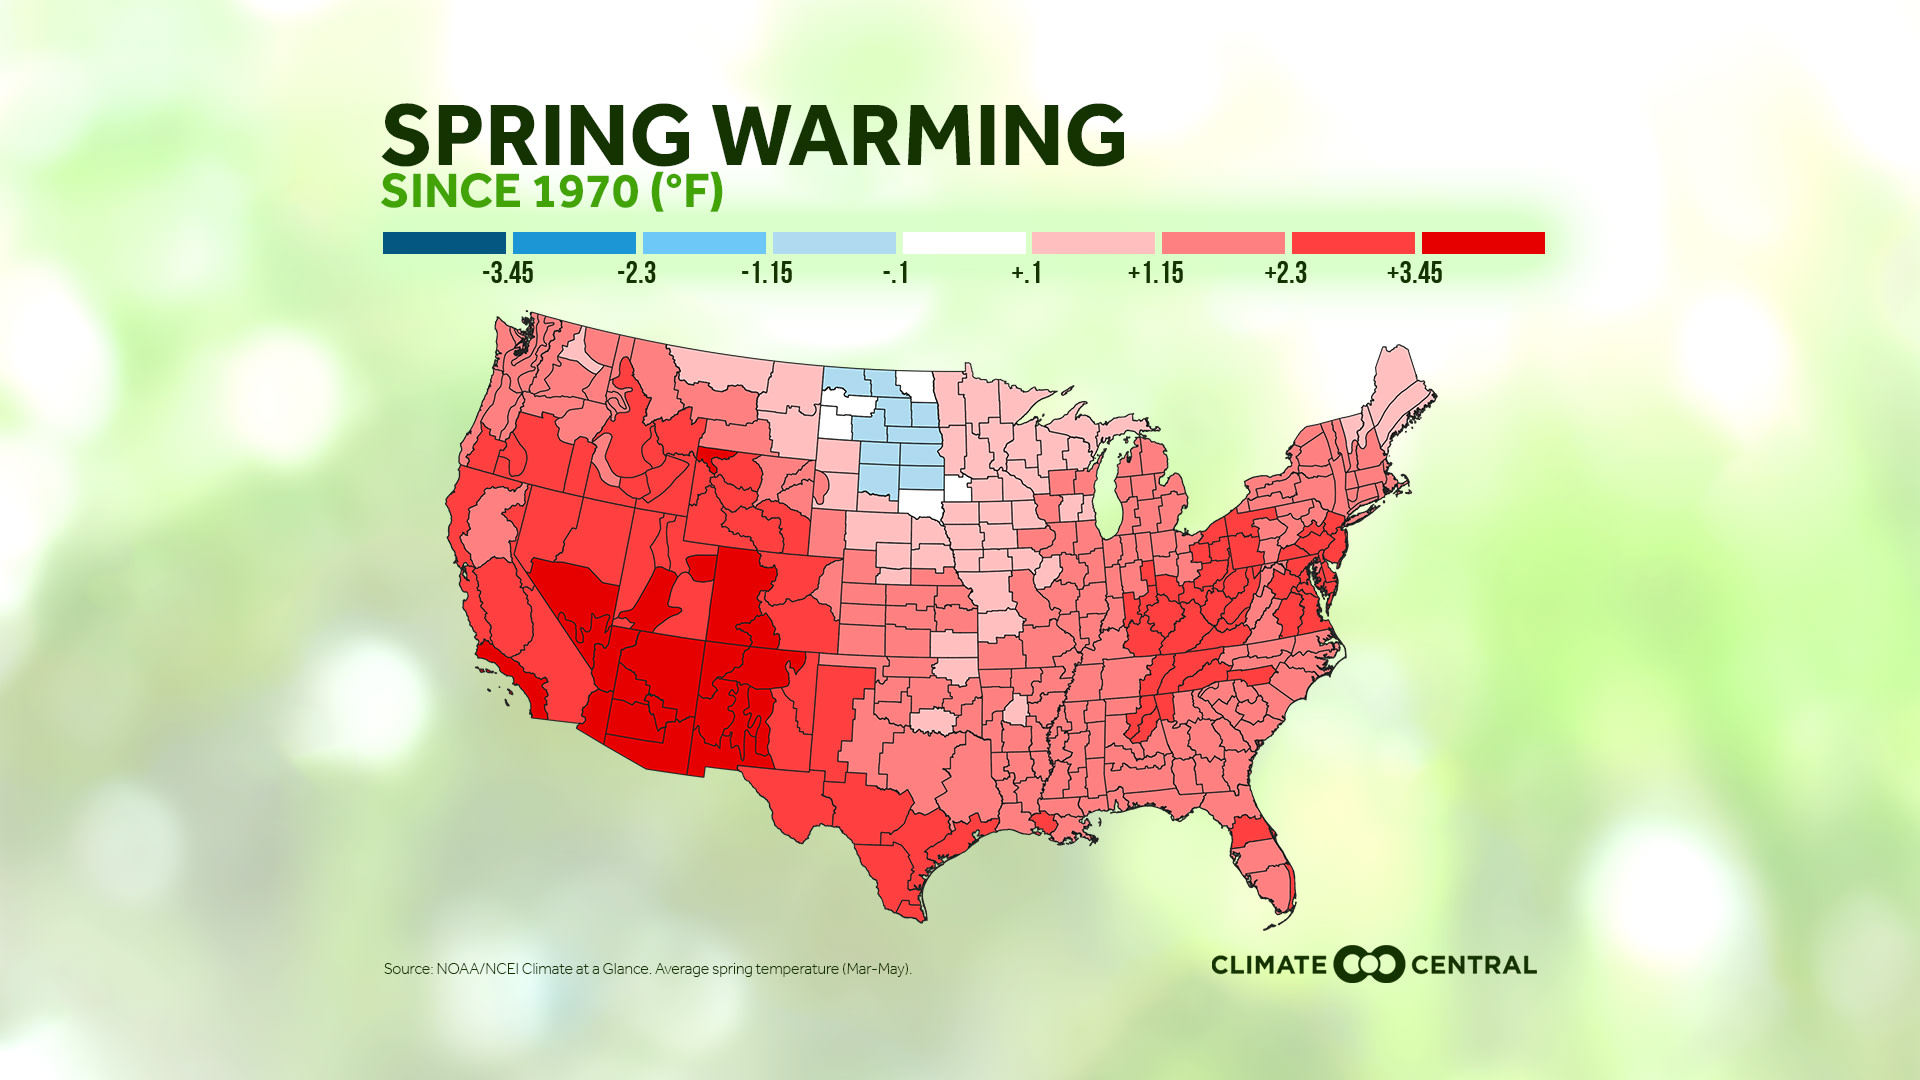
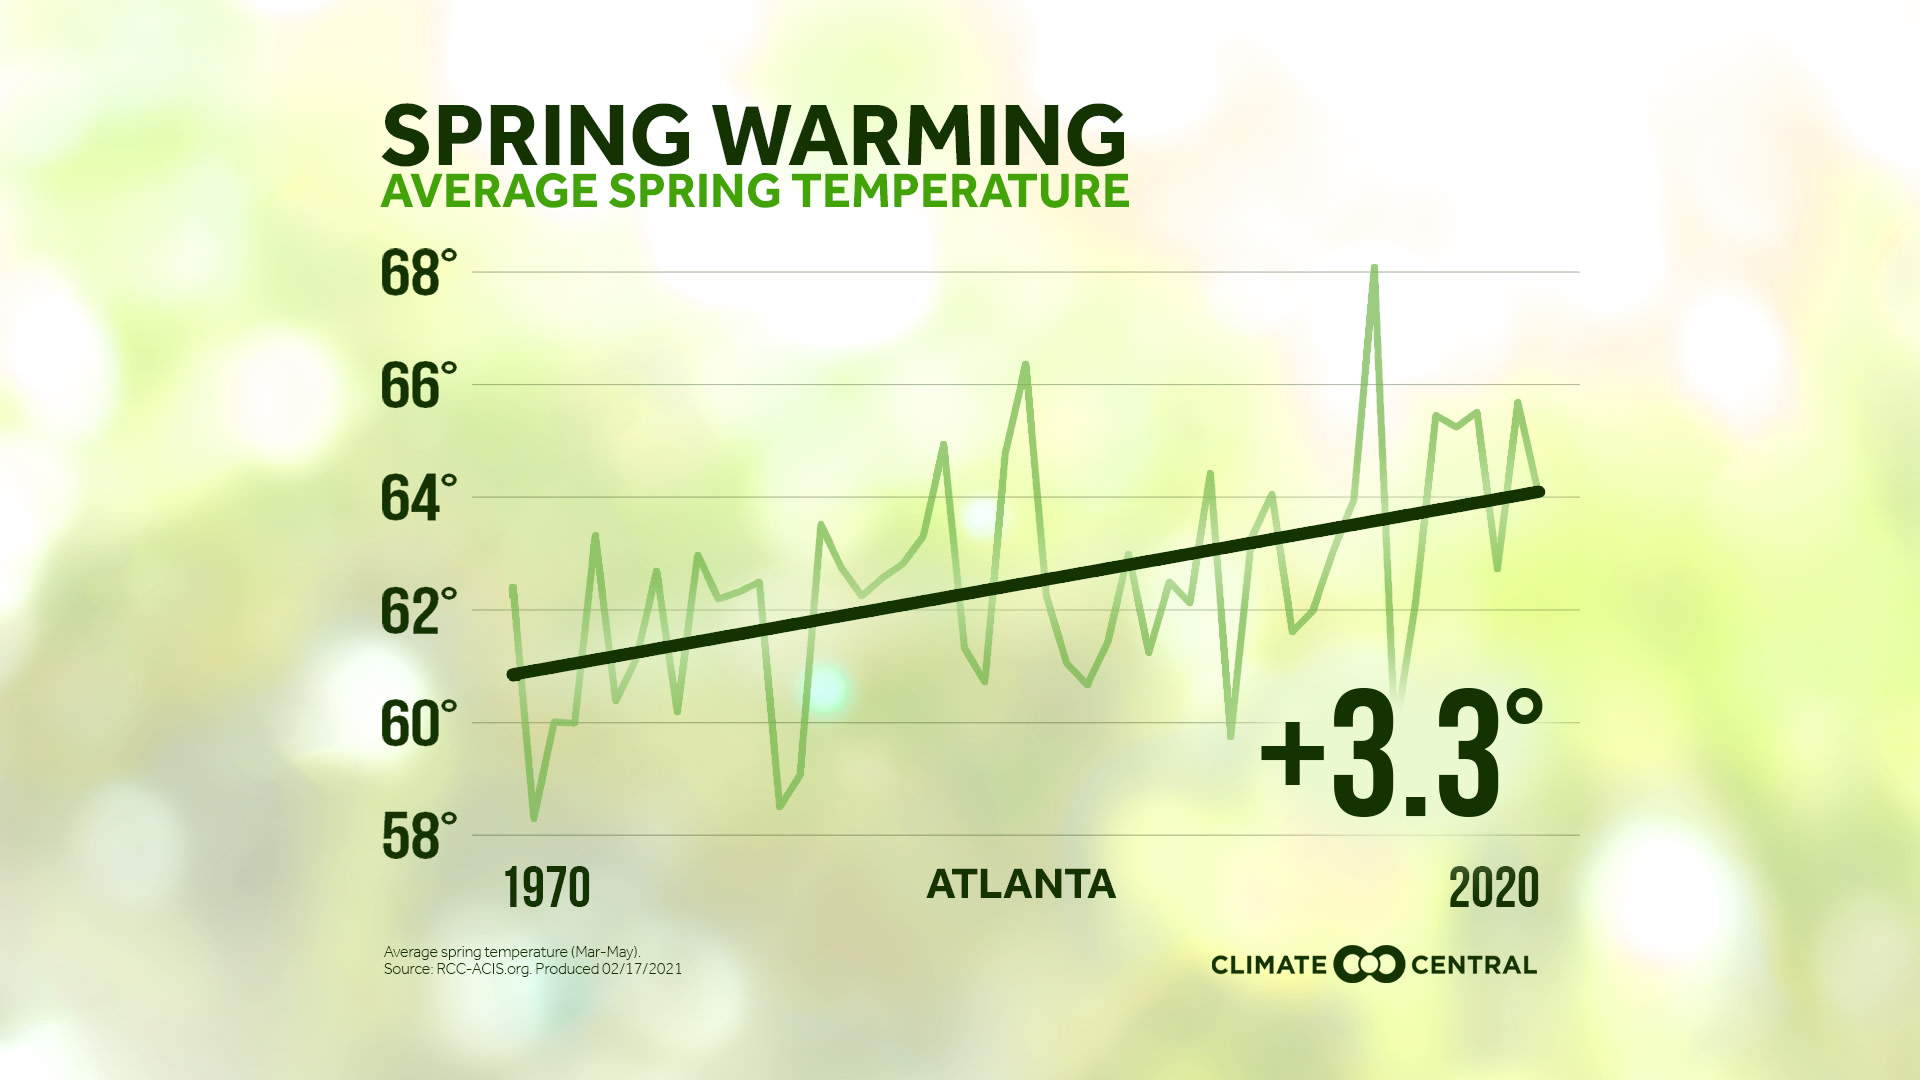
Spring average temperature trends locally and nationally
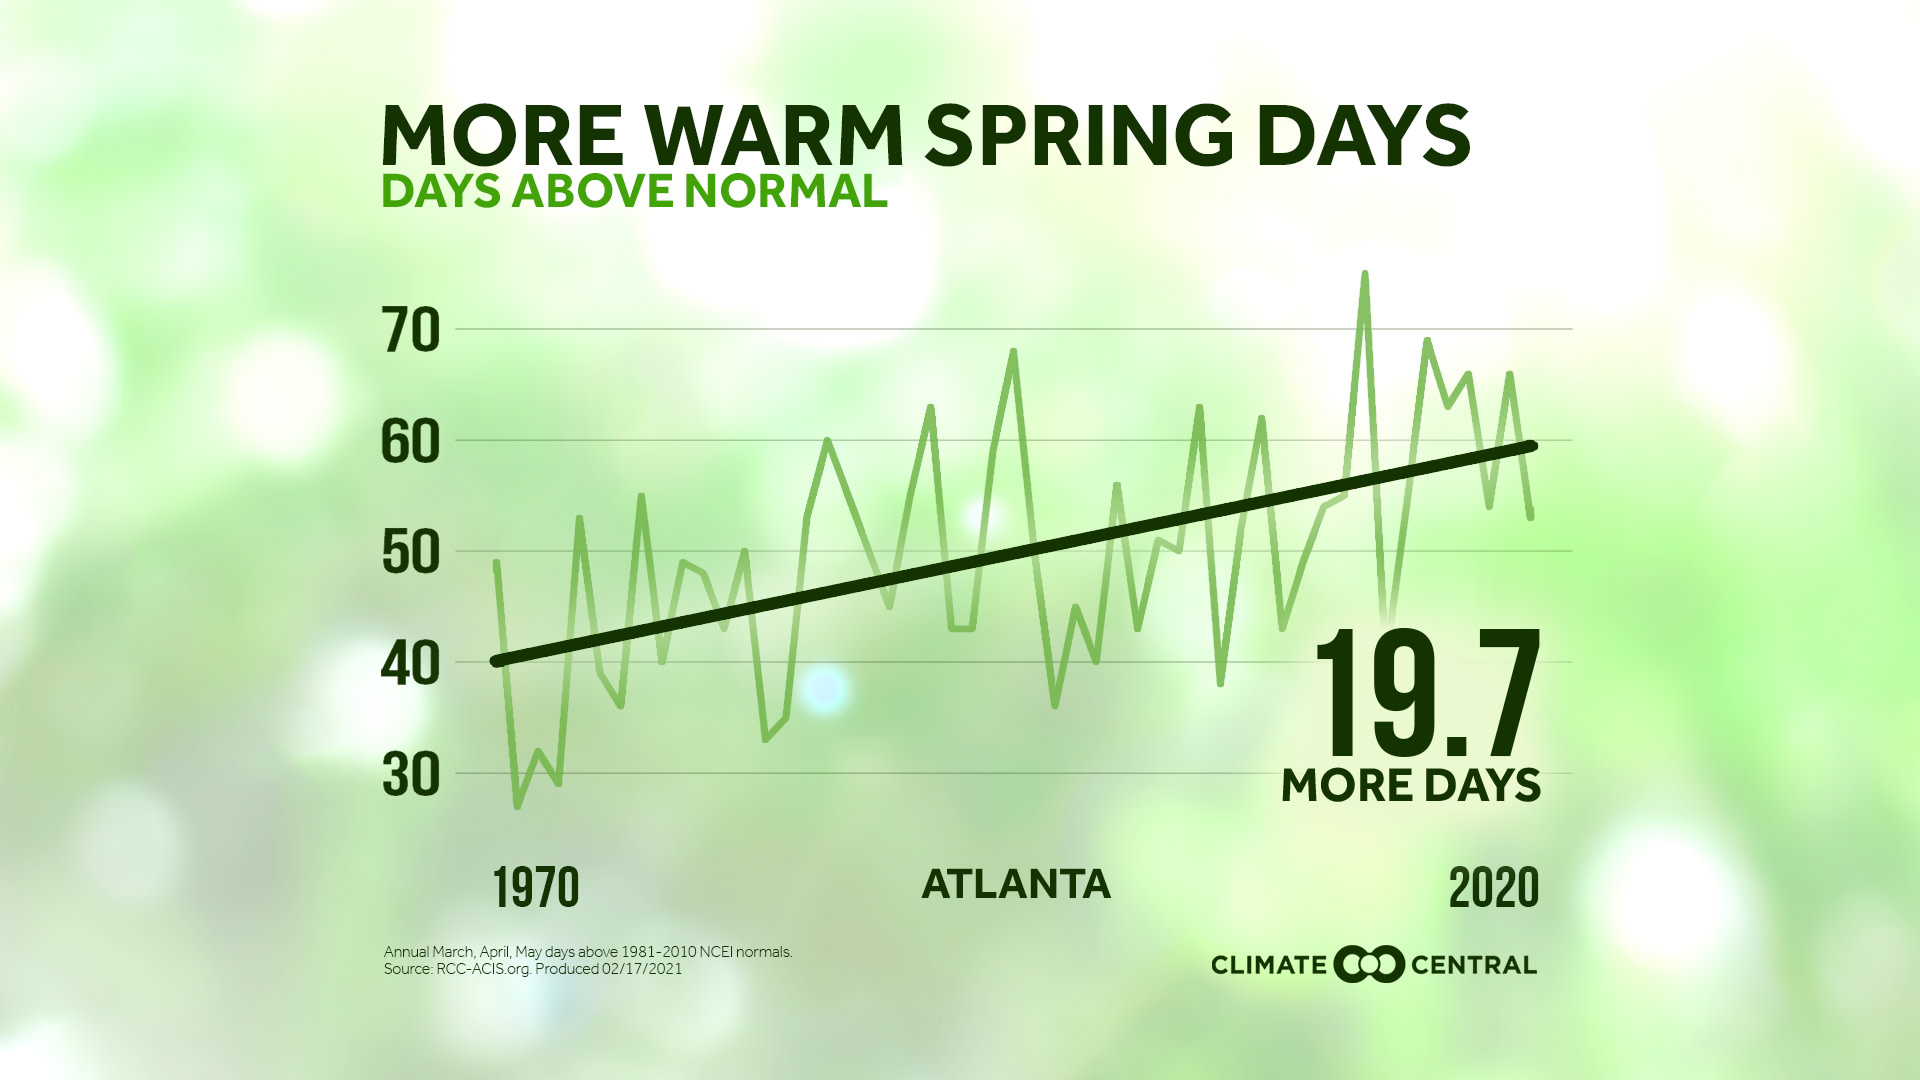
Change in the number of spring days with above normal temperatures
We just experienced a spate of winter storms and record-breaking cold air plunging across the middle of the country, precipitating the massive power failure in Texas, as well as the opening of emergency warming centers across states from Virginia to Louisiana. There is evidence to suggest that climate change can influence the tropospheric polar vortex, allowing the polar jet stream to break down and allow arctic air to dip into the lower latitudes. But, ready or not, the beginning of March next week also means the start of meteorological spring.
Long-term temperature trends show that, on average, spring is getting warmer. According to our analysis of 243 cities across the U.S., 120 cities (49%) have recorded an increase of 2℉ or more over the past fifty years. Further, 96% of cities (234) reported an increase in the number of above-normal spring days since 1970, with 81% of cities (196) reporting an increase of 5 days or more.
Warming spring temperatures follow a pattern of warmer seasons encroaching on the cold of winter—shrinking periods of cold that are important for the production of fruit, management of pest populations, and throwing the timing of natural events (known as phenology) into misalignment. Earlier snowmelt can result in changes in water availability and challenges to the breeding of native fish. Earlier spring temperatures can also lengthen the growing season, supporting longer pollen allergy seasons that start earlier and stick around for longer.
POTENTIAL LOCAL STORY ANGLES
When is spring blooming near you?
Meteorological spring arrives in a few days, but the signs of spring have their own schedule! Check out the “springcasting” tools at USA National Phenology Network, an organization of citizen scientists, government agencies, non-profit groups and others, who monitor seasonal changes in the natural world. USA-NPN tracks the onset of spring across the country and has historical, real-time, and forecasted phenology maps. These are important tools for forecasting invasive species and pests, allergy outbreaks, and informing agricultural calendars. The Asthma and Allergy Foundation of American (AAFA) just released their annual ‘Allergy Capitals’ report. Read their report to find out how your city ranks
Tools for reporting on phenology in your local area:
“Phenology” is the study of the timing of natural events. In spring, it’s the time that snow begins to melt and flower buds appear. Citizen or volunteer scientists are essential for tracking the seasonal changes in plants and animals, and USA-NPN’s Nature’s Notebook website provides all the tools necessary for locals to start recording their observations.
LOCAL EXPERTS
The SciLine service, 500 Women Scientists or the press offices of local universities may be able to connect you with local scientists who have expertise on the shifting spring season in your area. The American Association of State Climatologists is a professional scientific organization composed of all 50 state climatologists.
NATIONAL EXPERTS
Theresa Crimmins, Director at USA National Phenology Network
theresa@usanpn.org
(520) 621-8523Karin Gleason, Meteorologist - Monitoring Section, NOAA's National Centers for Environmental Information (NCEI), Center for Weather and Climate (CWC)
Karin.L.Gleason@noaa.govDr. Lewis Ziska
Environmental Health Sciences at the Columbia University Irving Medical Center
Contact: Timothy Paul, tp2111@cumc.columbia.edu
METHODOLOGY
Analyses used 1970-2020 data from the Applied Climate Information System. The number of spring days above normal was calculated using the 1981-2010 NOAA/NCEI normals.
Displayed trend lines are based on a mathematical linear regression. Climate Central's local analyses include 246 stations. However, for data summaries based on linear trends, only 243 stations are included due to large data gaps in Tuscaloosa, Hazard and Wheeling.