Climate Matters•January 29, 2020
2020 Superbowl: Sea Level Rise and Warming NFL Cities
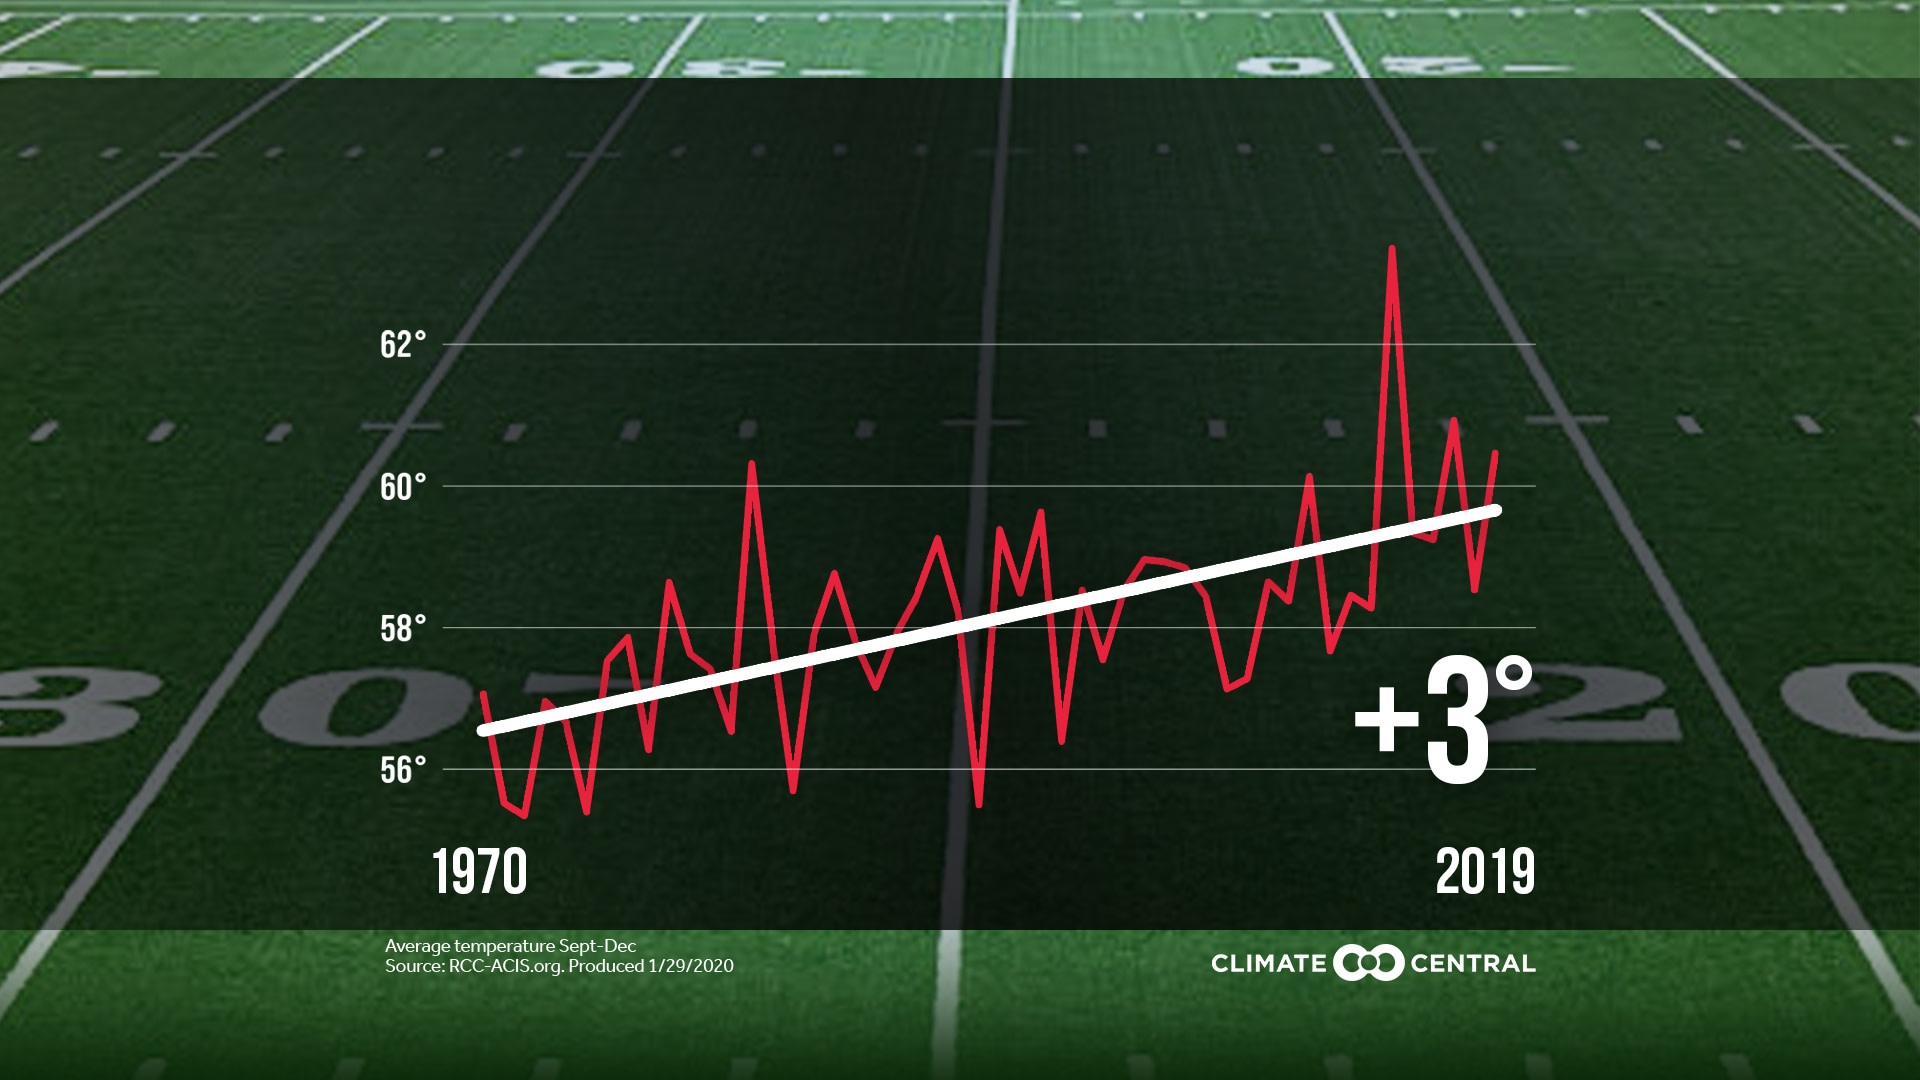
It's Super Bowl week, so we've looked at how climate change affects football—from temperature trends of the past 50 years to the risk of flooding 50 years in the future. Football seasons have warmed in every NFL city.
In the past half-century, NFL cities have trended warmer by at least 0.7°F and as much as 5°F, if you count the Raiders’ new home in Las Vegas. Next-highest are the Minnesota Vikings and Arizona Cardinals, whose home cities have heated up more than 4°F since 1970. Of the Super Bowl teams, San Francisco's warming trend is more than double Kansas City’s (3.0 vs. 1.3°F), while Hard Rock Stadium in Miami falls in the middle (2.5°F).

Image: Climate Central/Nickolay Lamm
That stadium may face increased flood risk as climate change accelerates sea level rise. The above image illustrates what Hard Rock Stadium could look like if the water level was 6 feet above the local high tide line. Water could reach this level through a combination of sea level rise, tides, and storm surge. According to Climate Central’s Portfolio Analysis Tool, almost all areas of the stadium property may experience occasional flood risk by 2070—if greenhouse gas emissions continue unabated.
It’s not just the sports venues; climate change heightens risks for athletes as well. Heat stroke is a major concern in football, and wildfires have caused hazardous air quality at this year’s Australian Open. Sports organizations are recognizing the impacts of climate change and are working to address them—taking steps to adapt like the Aussies’ new extreme heat policy, and installing thousands of solar panels to reduce their carbon footprint.
METHODOLOGY: Temperature trends plot data from the Applied Climate Information System, based on a mathematical linear regression. NFL graphics use the average temperature during football season (September - December) in each of the 30 NFL cities. The Portfolio Analysis Tool estimates flood risk under unchecked carbon emissions and sea level rise modeling from Kopp 2014. See the report for full details.