THIS IS NOT THE MOST RECENT VERSION AVAILABLE. LINK TO THE MOST RECENT VERSION.
This year we’re introducing something new—updating our most popular seasonal trends and combining them into a neat package at the beginning of every season! With the start of meteorological summer on June 1st, this package includes:
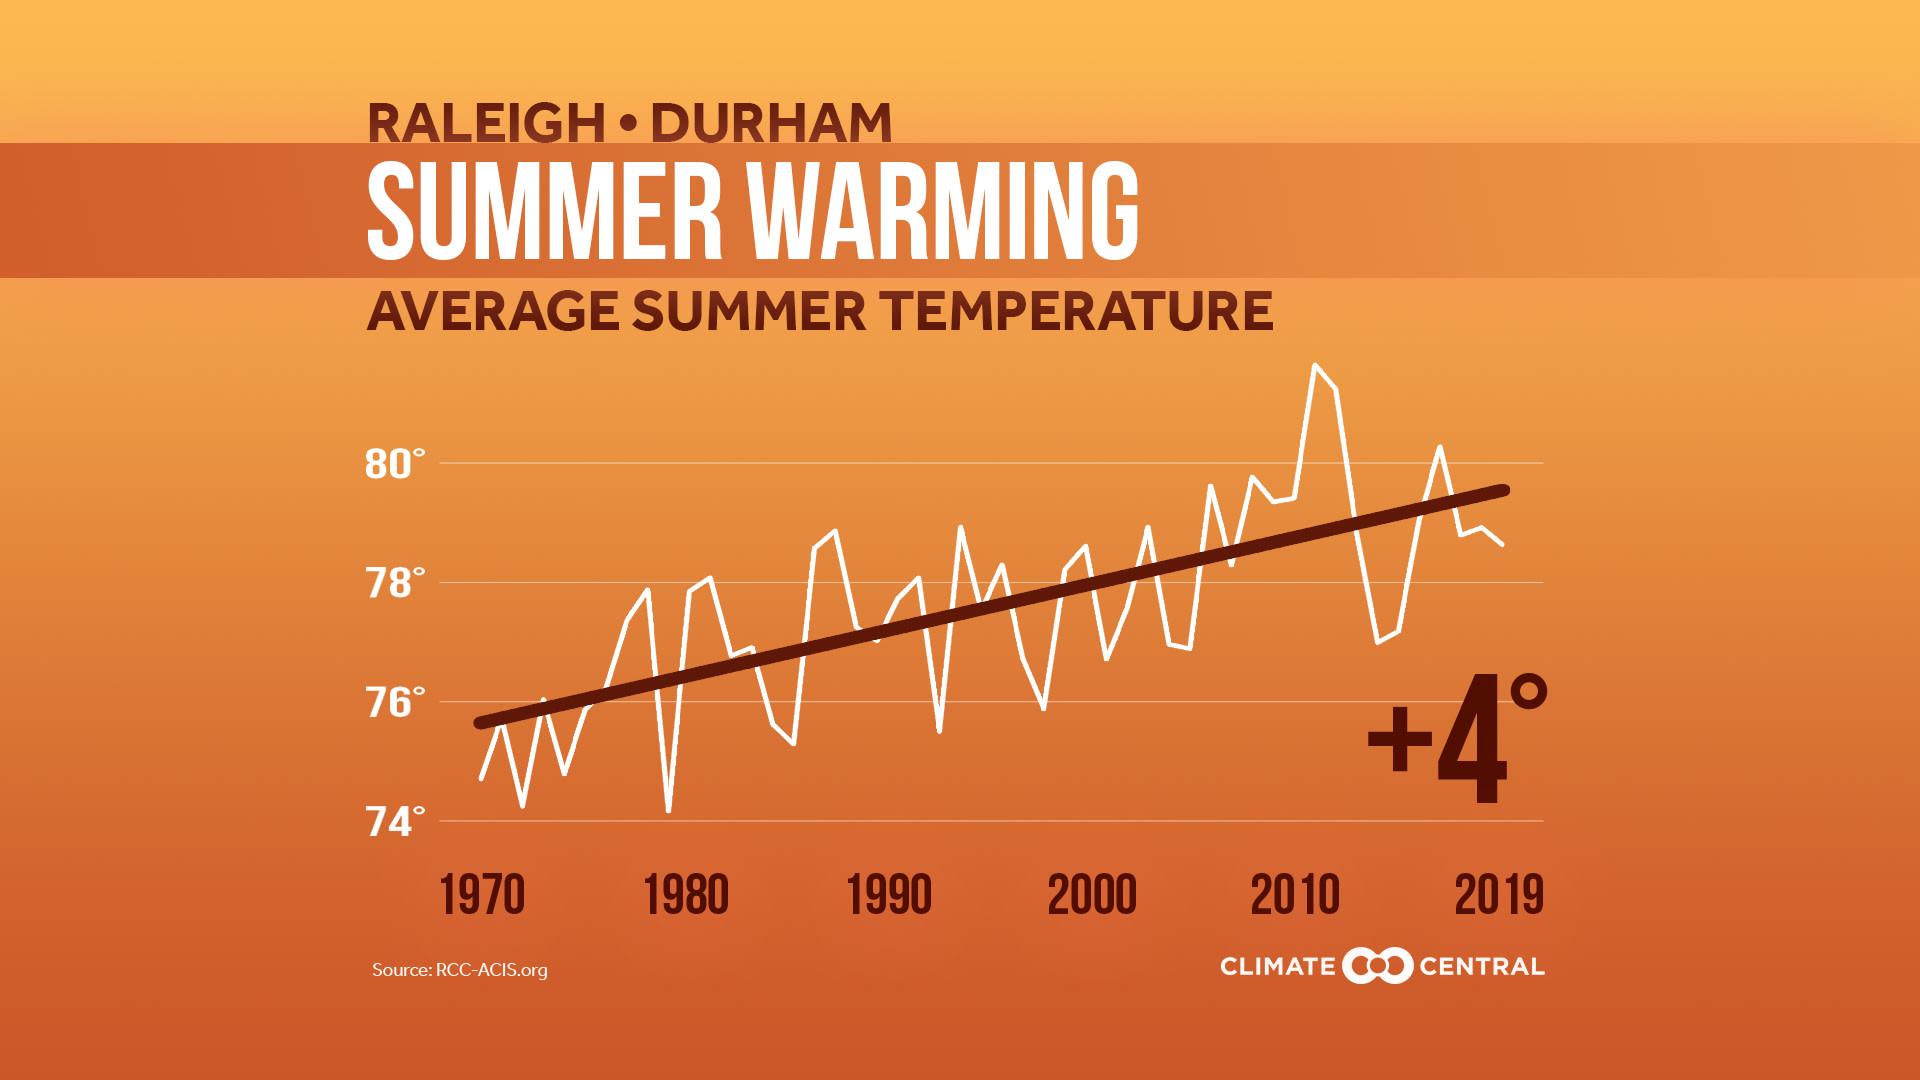
Average Summer Temperatures, local trends and a national map
Summer Days Above Normal, and
Summer Night Temperatures
Summer Night Temperatures
Local Market Versions Available
Find Images for Your Market Here (JPG & PNG)
National Map
Continental United States
Find All Image Types Here (JPG & PNG)
KEY CONCEPTS
Summers are getting hotter. In the past fifty years, 74% (179) of the 242 cities analyzed recorded an extra week or more of days with above-normal temperatures. The top 30 cities with the greatest increases, all recording a month or more of additional days above normal, were concentrated in the southern United States一particularly in the Southeast and Texas.
42% of cities (101 of 242) reported an increase in average summer temperatures of more than 2℉ since 1970. Summer low temperatures are increasing more rapidly, with 53% (128) of cities recording increases of more than 2℉.
Warm summer nights make it difficult for the body to recover from extreme daytime heat, especially in urban areas which cool down less at night. Summer heat can also contribute to stagnant air which traps harmful pollutants and leads to worsening air quality.
Looking at average summer temperatures, 94% (228) of the 242 cities analyzed recorded an increase, including 101 (42%) cities that warmed by more than 2℉ since 1970. This warming trend is also reflected in the change in individual summer days above normal, with 93% (226) of cities recording an increase since 1970 and 74% (179) of cities with an increase of a week or more. The top 30 stations with the greatest increases, all recording more than a month of additional days above normal, were concentrated in the southern United States一particularly in the Southeast and Texas.
While it’s usually summer high temperatures and record-breaking heat that get the most attention, summer nights are warming faster than summer days. Analyzing low temperatures, 53% (128 of 242) recorded a rise of more than 2℉, on average, since 1970. Overnight low temperatures can offer a vital reprieve during extreme heat一allowing the body to recover and the environment to cool down. This cooling effect is particularly necessary in urban environments, which hold more heat and have fewer trees to provide shading and evapotranspiration. However, while heat exposure may be greater in urban areas, many social factors like age, income, health status and social isolation may make rural populations more vulnerable一particularly in regions that are relatively unaccustomed to extreme heat and have less access to air conditioning.
Summer heat can also contribute to poor air quality, often accompanied by air stagnation which traps harmful pollutants. While we learned about temporary reductions in air pollution due to COVID-19, these improvements will not last as businesses reopen and the heat kicks in. Longer-term solutions are necessary to provide lasting benefits which can help us to slow climate change as well as adapt to the impacts. Adding green spaces to act as cooling centers and improving the energy efficiency of buildings are just some of the climate solutions at our fingertips.
METHODOLOGY
Analyses used 1970-2019 data from the Applied Climate Information System. Displayed trend lines are based on a mathematical linear regression. The number of spring days above normal was calculated using the 1981-2010 NOAA/NCEI normals. Climate Central's local analyses include 244 stations. However, for data summaries based on linear trends, only 242 stations are included due to large data gaps in St. Johnsbury, Vt. and Wheeling, W. Va.
