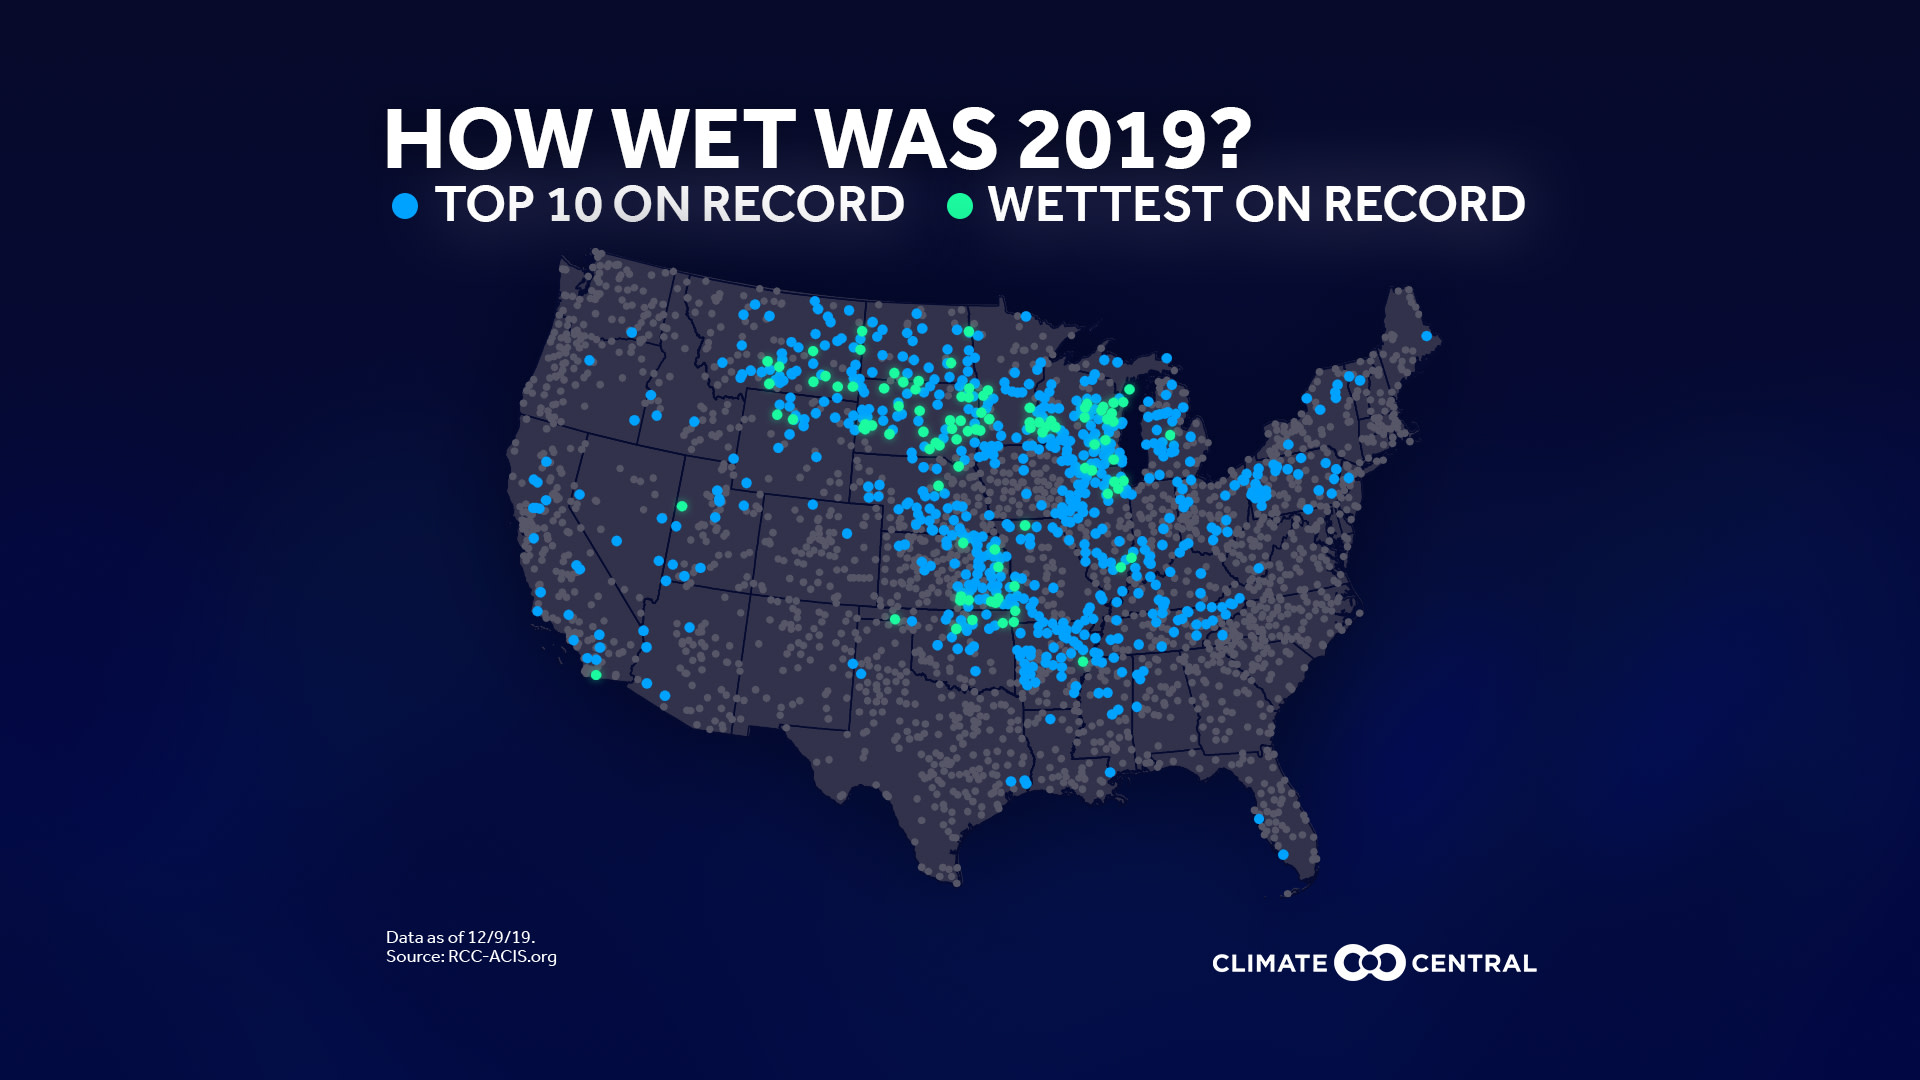
As we approach the end of 2019 and reflect on this year’s climate in the news, the main story for the United States has been record rainfall—again.
In 2019, 98 stations of the 2750 stations analyzed have already had their wettest year on record, while an additional 645 have recorded a top 10 wettest year. More top records were set in 2018 (133) than in 2019, but this year there are more stations recording 2019 as one of their top 10 wettest years (685 in 2018, 743 in 2019). This year’s most intense rainfall was concentrated in the Midwest and Great Plains—areas that have struggled to cope with devastating flooding.
The trapping of heat by greenhouse gases is resulting in rising global temperatures. Not only does this mean that more water evaporates from the land and oceans, but a warmer atmosphere can hold more water vapor—for every 1°F of warming, the saturation level of the atmosphere increases by about four percent. This leads to extreme precipitation events that are both heavier and more frequent. July 2018 - June 2019 was the wettest 12 month period on record for the U.S., and 2019 is on track to be the wettest year ever recorded.
With title:JPGPNGGIF | No Title:JPGPNG
Here are some of our recent releases to help tell the story about this year’s rainfall and how precipitation patterns have been changing:
With title:JPGPNG| No Title:JPGPNG
Precipitation events once considered rare are now occurring more often than we would expect. So much so that, in 2018, NOAA adapted the rainfall values that define the severity of extreme rainfall events. Such extreme flooding can be especially damaging in places where water infrastructure (such as levies, stormwater management systems and sewage systems) is aging and may be unable to cope. The result: severe costs in damages to property and losses to industry (e.g. agriculture). According to NOAA, the 18 billion-dollar flood events experienced by the U.S this decade have resulted in losses of at least $40 billion.
METHODOLOGY: Local accumulation graphs were created using daily rainfall data from the Applied Climate Information System. For the national records map, annual precipitation data was collected from ACIS and ranked for more than 2,500 stations. 2019 year-to-date data is through 12/8/19. Annual statewide precipitation data was obtained from NOAA/NCEI State Climate for November.
