Climate Matters•May 22, 2019
2019 Rain in Context

As recent flash flooding in the Southeast made clear, heavy rain just will not stop. Last week, we covered the increase in extreme downpours — single-day rain events that are getting wetter. But this year has also brought longer-lived rain, helping areas of the Mississippi stay above flood stage for at least three months. That’s the longest stretch since the Great Flood of 1927 — the most destructive river flood ever in the modern U.S. Overall, the nation’s year-to-date rainfall is well above average, in line with the increased annual precipitation observed in most of the country.
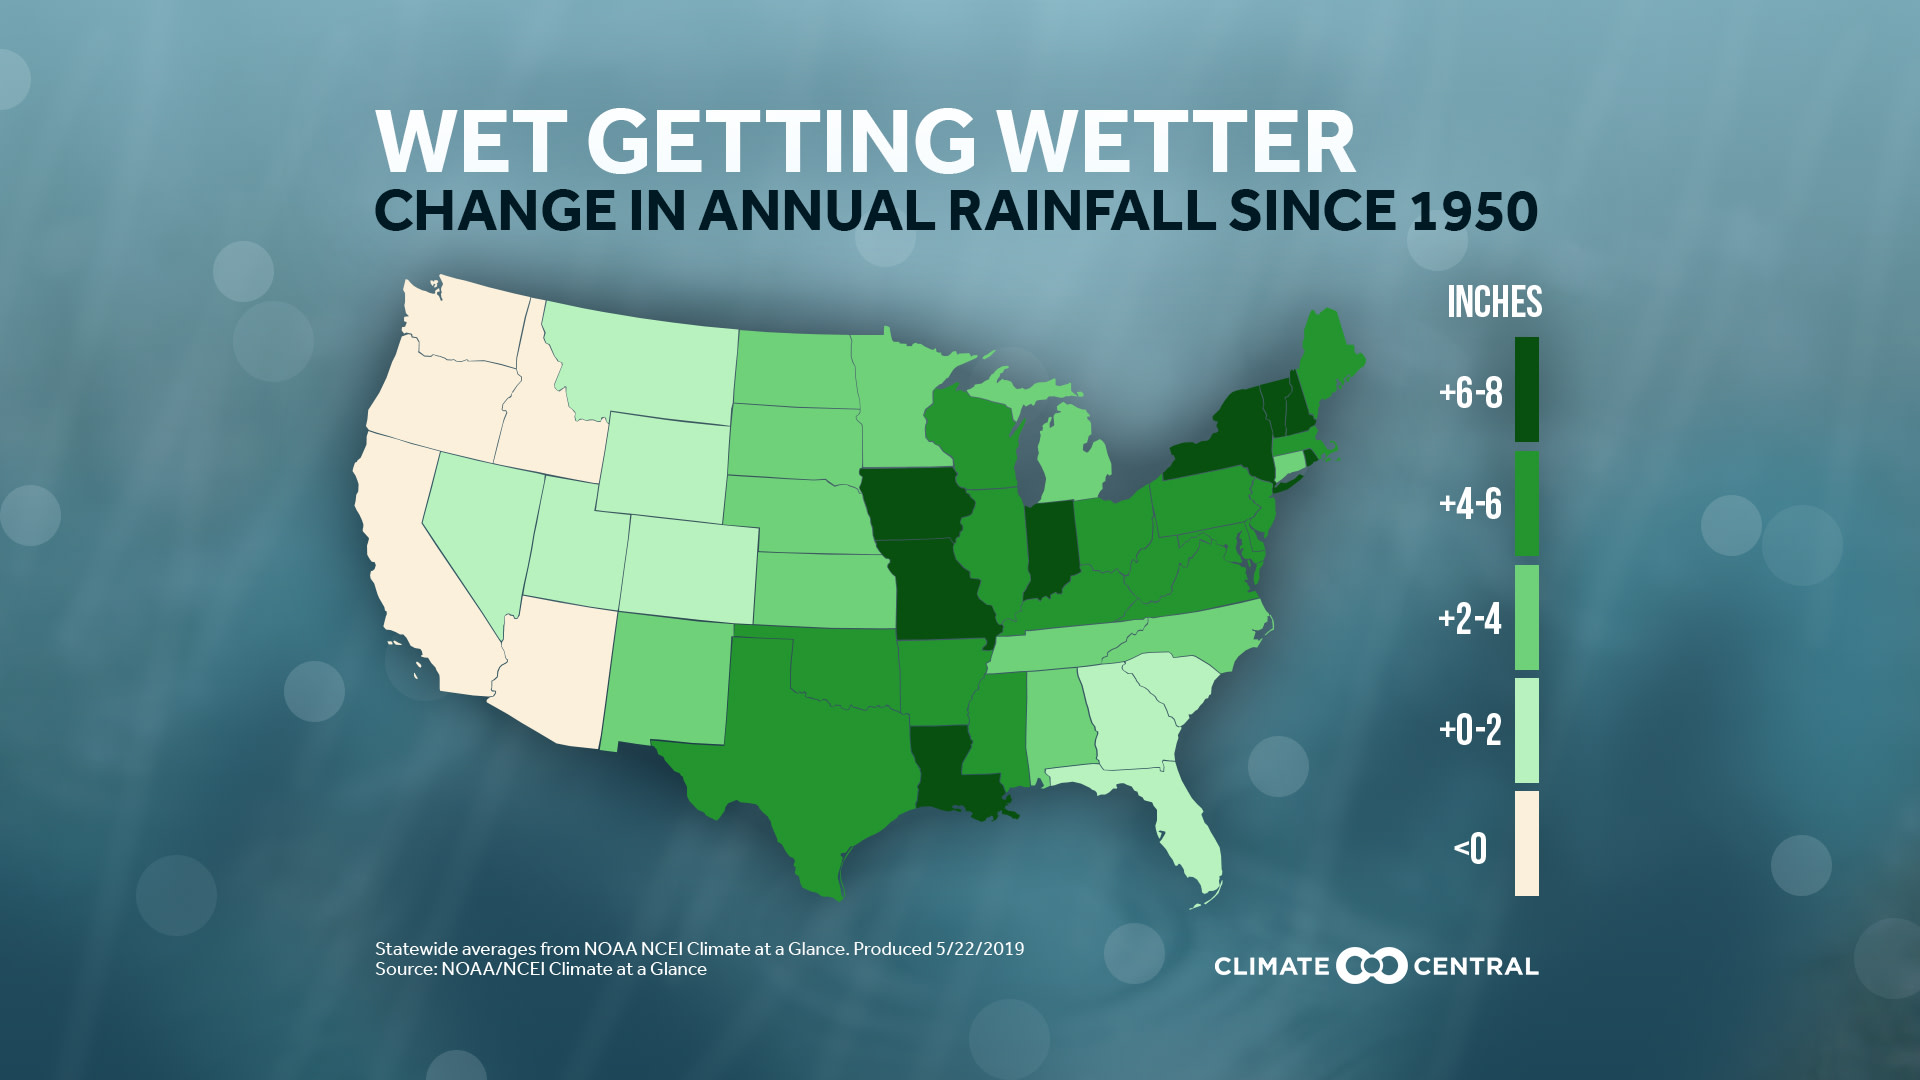
From 1950 to 2018, average annual precipitation has risen in 90% of the U.S. states analyzed. Eighteen states have recorded an increase of five inches or more, led by New Hampshire (7.0 inches), Vermont (7.0 inches), and Indiana (6.6 inches). The eight largest increases have all come in the Northeast and Midwest, where downpours are also intensifying the most. Only five Western states are trending drier, including Oregon, California, Idaho, Washington, and Arizona. Though these decreases are all less than three inches, an inch or two can make a major difference in the drier West (where many states receive less than 25 inches per year). And even for the drier states, single downpours are still getting stronger.

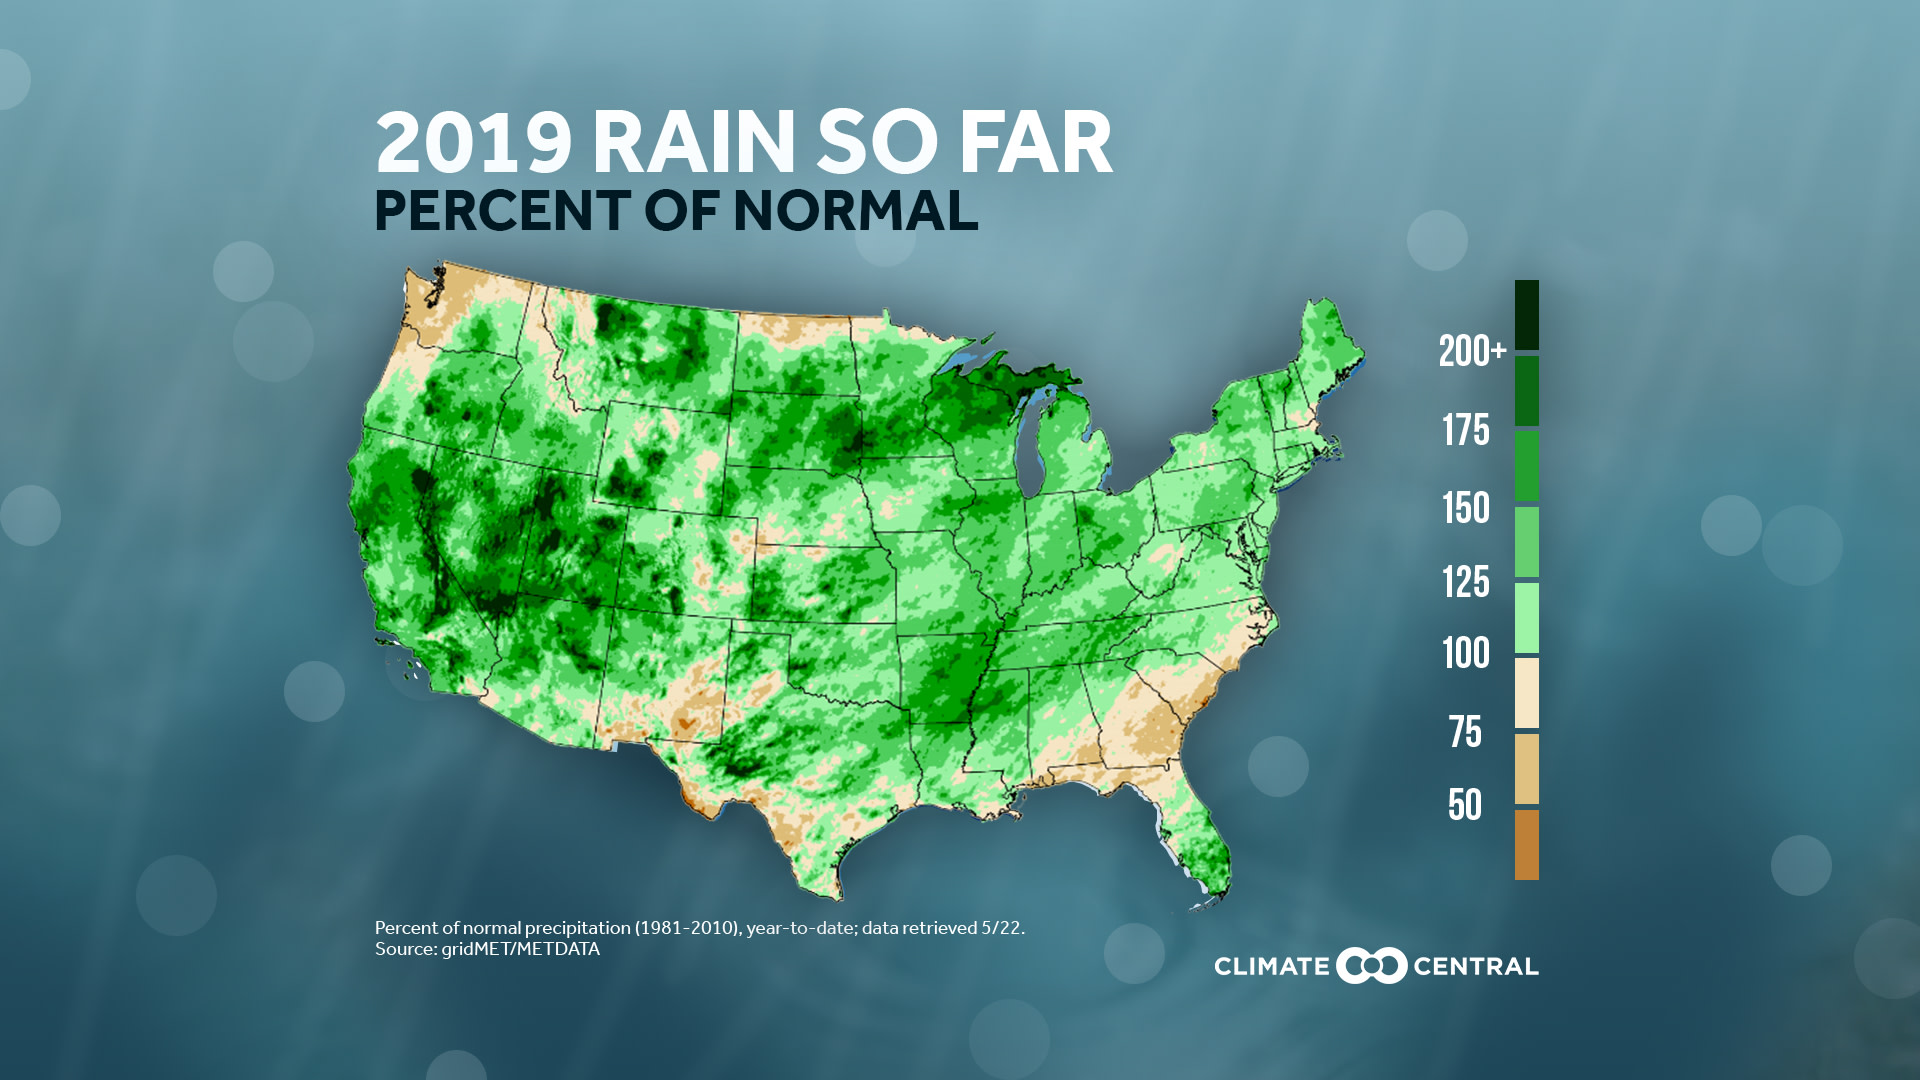
2019 is taking some trends to the extreme. According to data analysis from Climate Engine, the great majority of the country has experienced above-average rainfall so far this year. Vast swaths of the Eastern interior have measured anomalies of 6 inches or more, which usually means at least 30% above average. Parts of the Midwest and Rockies are 50% to 100% above average. Only the Pacific Northwest, coastal Southeast, and spots in the Plains have observed below-average precipitation. In fact, the last 12 months have been the wettest on record.
Climate change has a mixed effect on overall precipitation, altering weather patterns that may vary by season and latitude. However, the impact on heavy rain is much clearer. As higher temperatures supercharge the water cycle, downpours are getting stronger and amplifying flood risks. This year’s extremes exemplify the impacts of our already warming world.
Methodology: Each state’s change in average annual rainfall since 1950 was calculated using a mathematical linear regression. Data obtained from NOAA/NCEI Climate at a Glance. Hawaii and Puerto Rico did not have data available. Year-to-date precipitation data for the contiguous U.S. was obtained from the METDATA set (via Climate Engine) as of 9am ET on 5/22/19. Percents are relative to the 1981-2010 climate normals.