Climate Matters•January 22, 2018
2017 Global Temperature Review

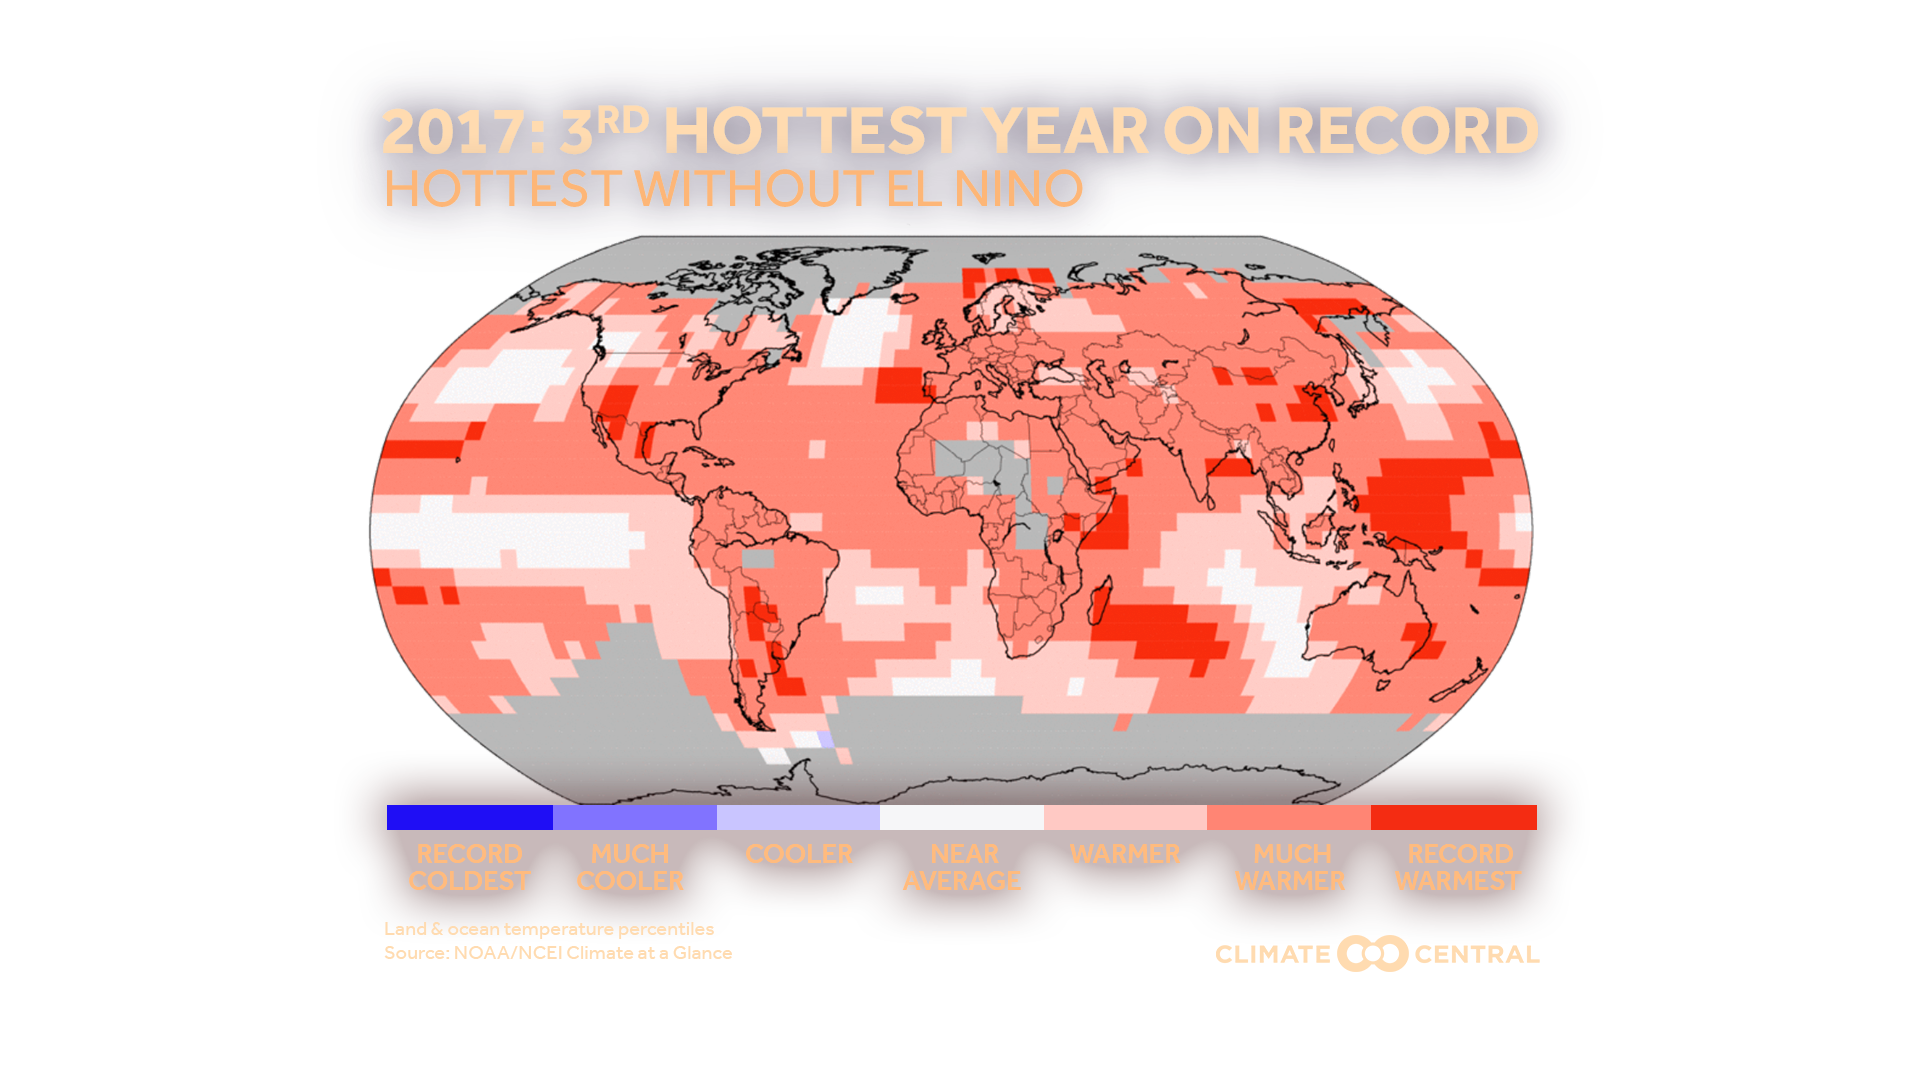
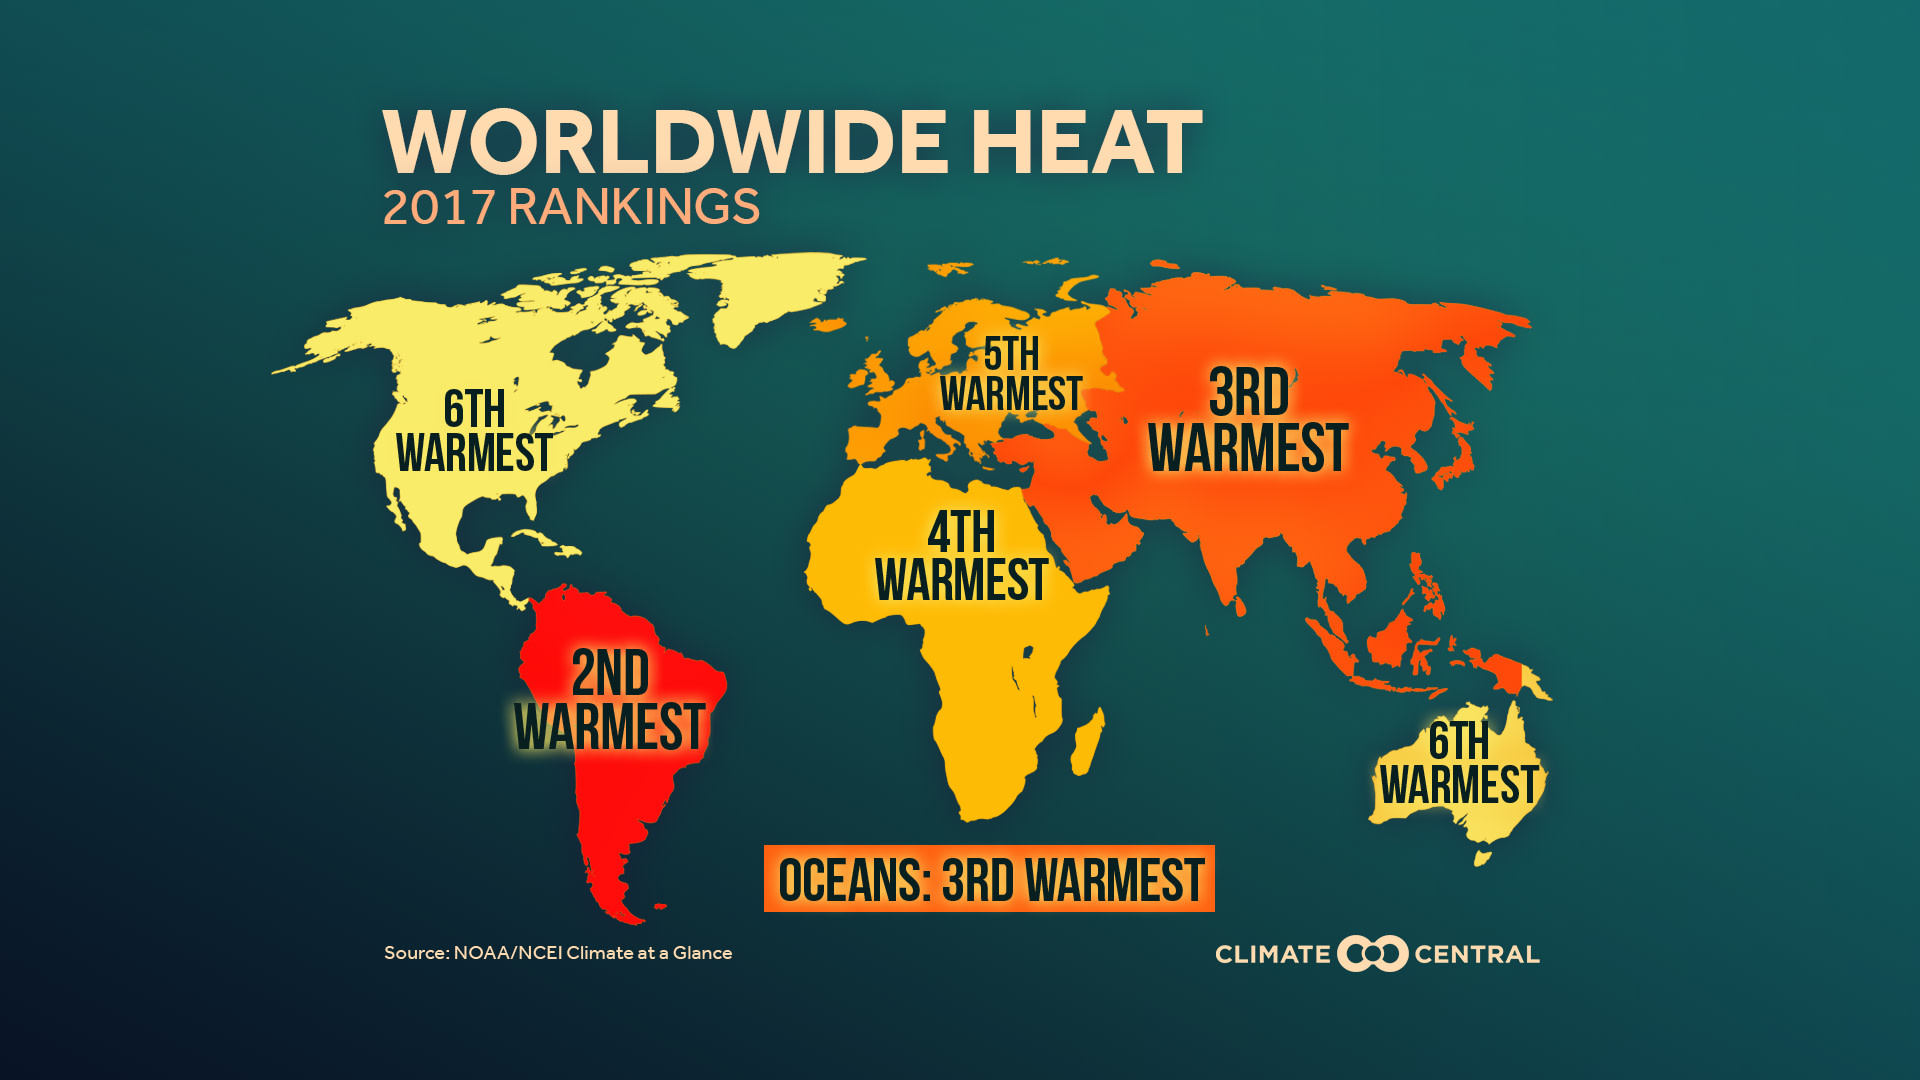
According to NOAA, 2017 finished as the third-warmest year globally since records began (NASA ranked it second-warmest). This is the warmest year on record without an El Niño in the Pacific Ocean, as neutral conditions existed in the Pacific until La Niña developed in the fall. Even so, the global ocean was still the third warmest on record, highlighting its primary role in the long-term global temperature pattern, and helping each continent have one of its 10 warmest years on record.
Combining the data sets from NOAA and NASA finds:
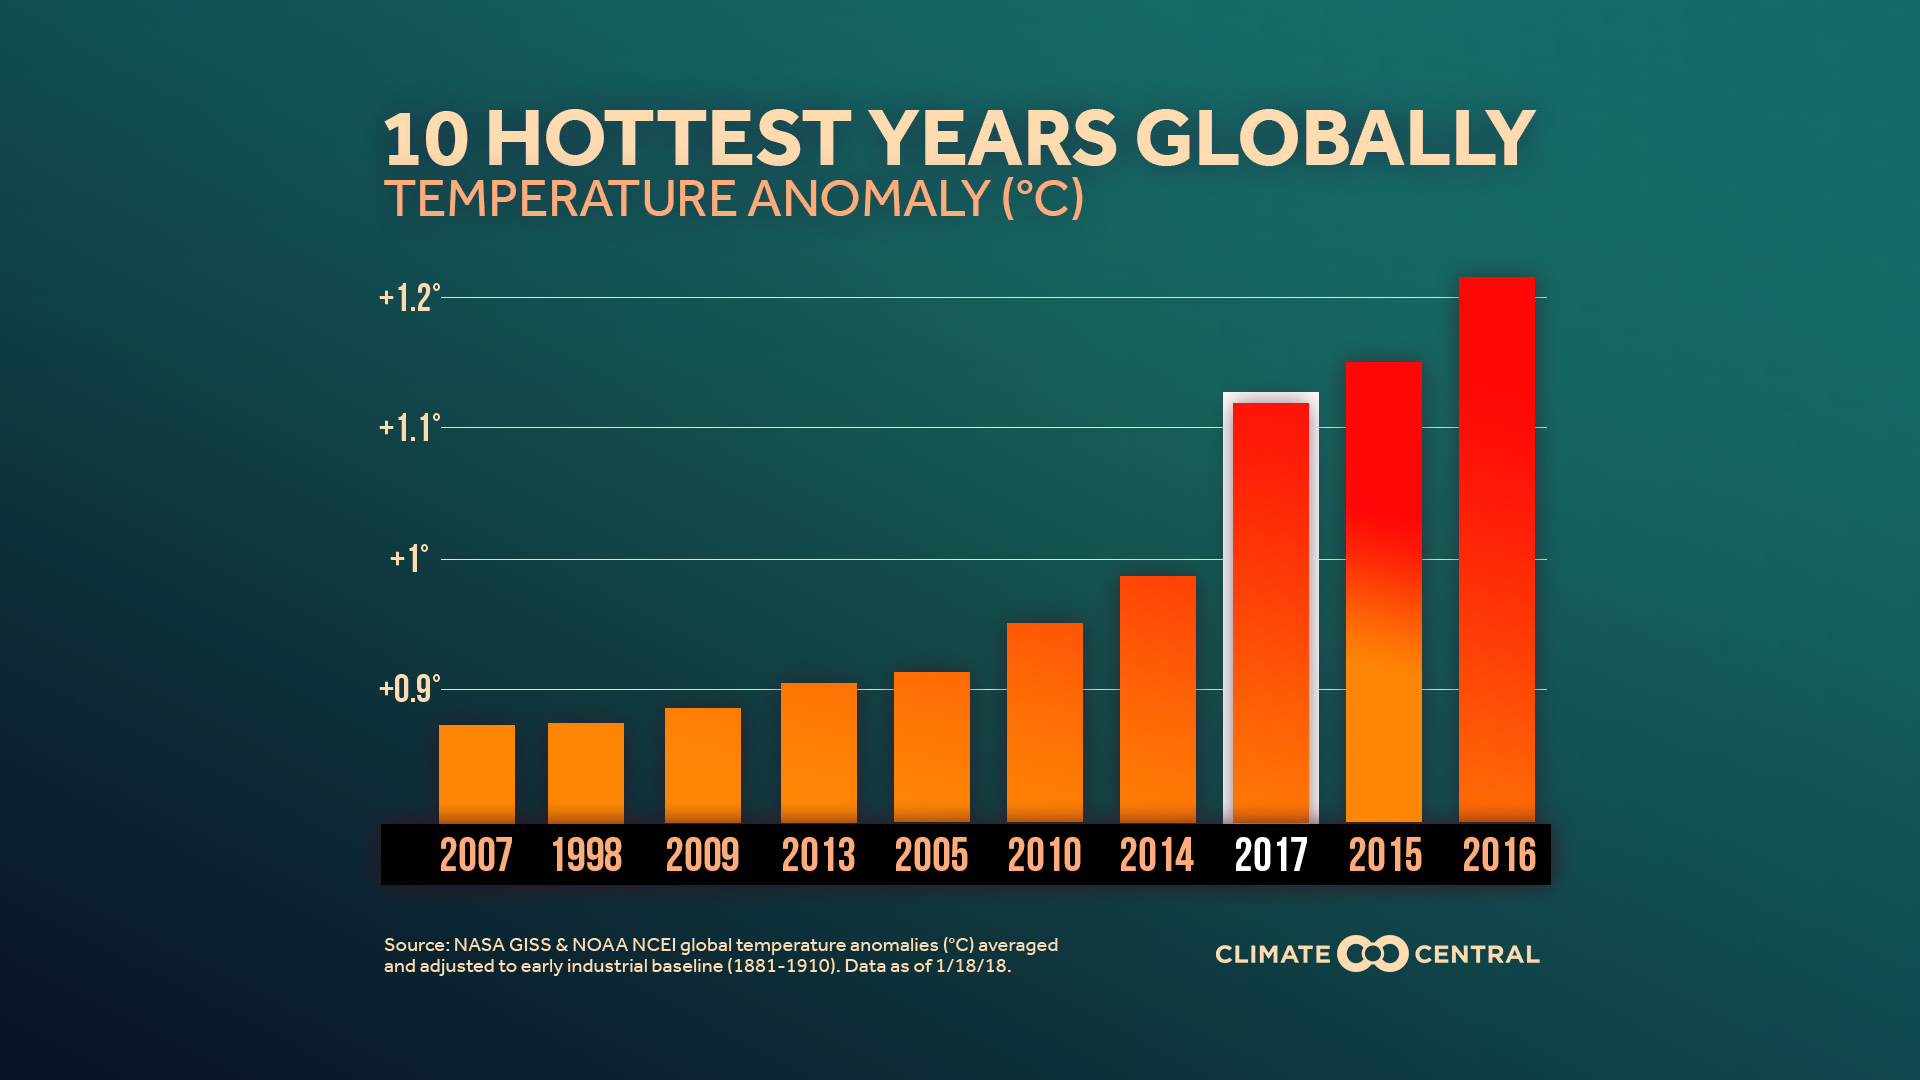
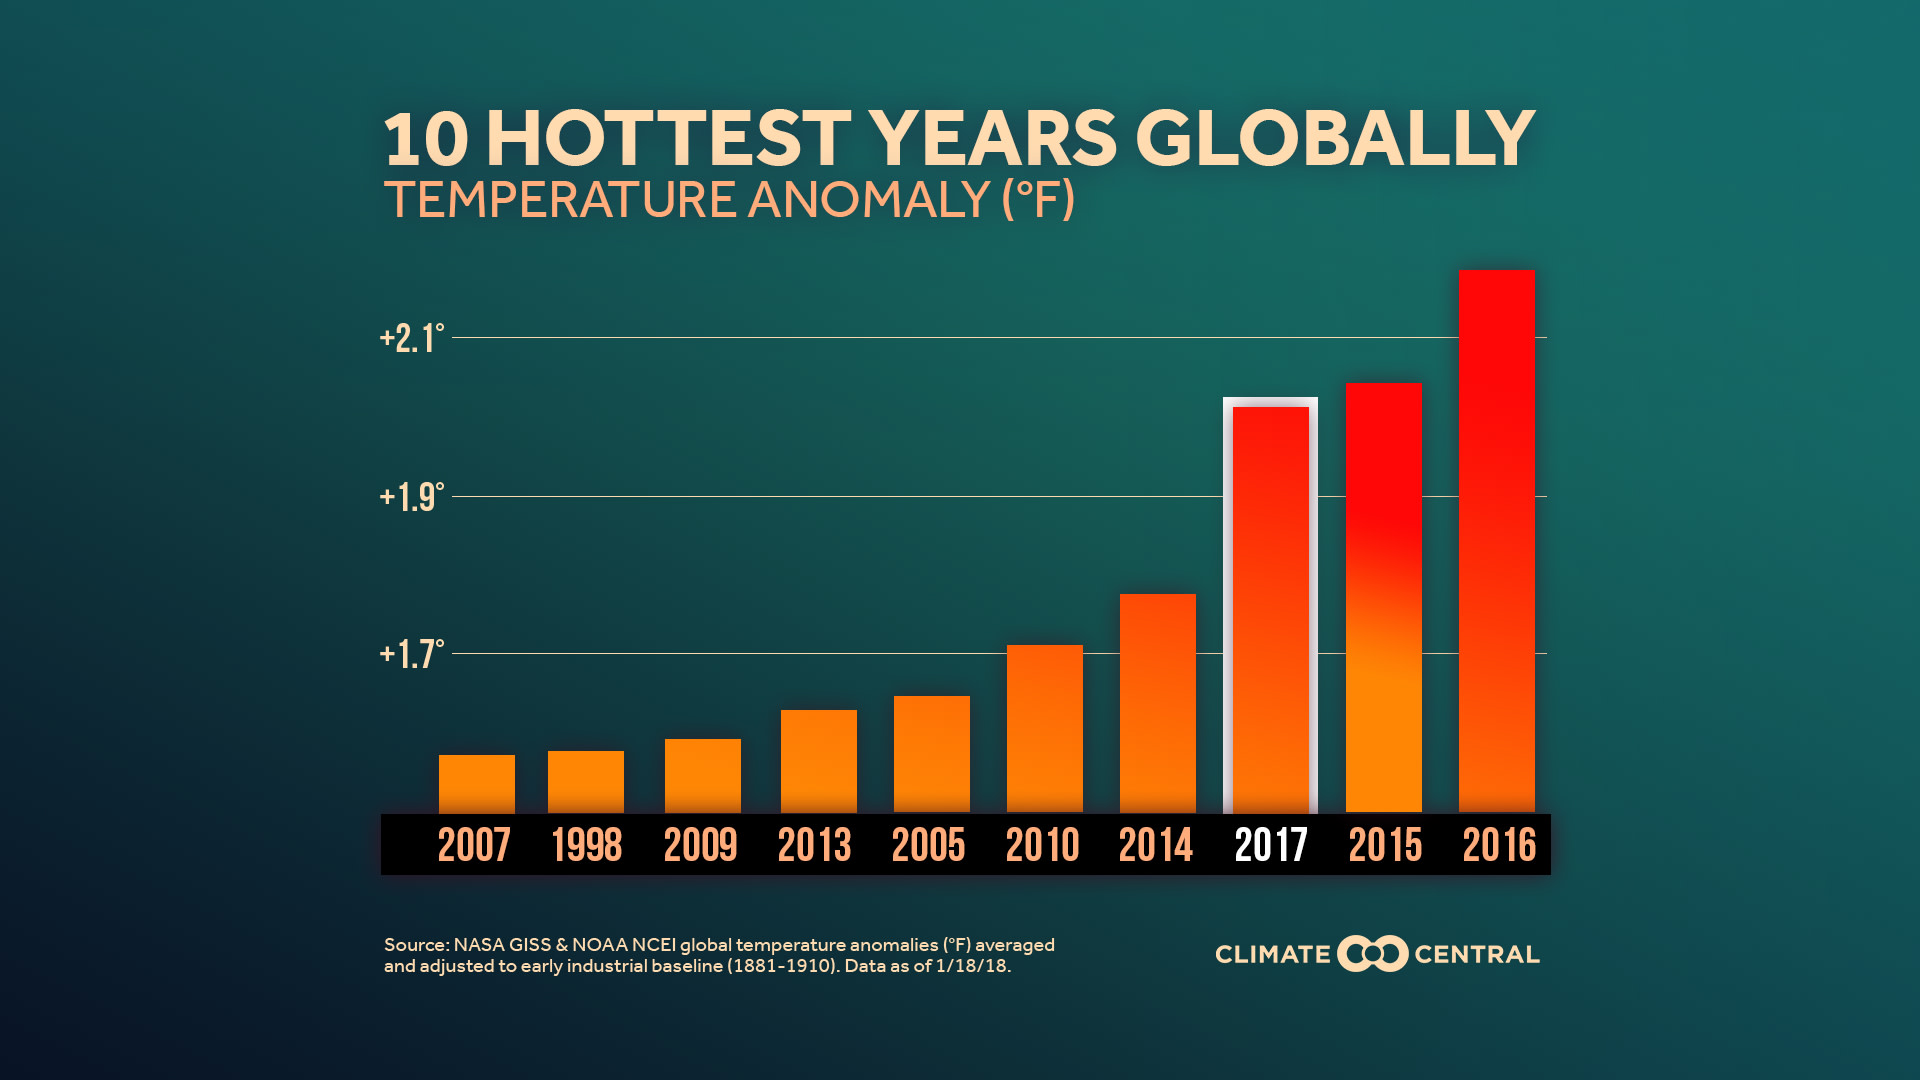
The five warmest years in the global record have all come in the 2010s
The 10 warmest years on record have all come since 1998
The 20 warmest years on record have all come since 1995
A few locations had their warmest year on record, including eastern China, the southwest U.S., and eastern Australia. And consistent with the current La Niña, the far western equatorial Pacific Ocean had its warmest year on record, with easterly trade winds pooling the planet’s warmest water there.
Combining the data sets from NASA and NOAA indicates that the the average global temperature was 2.02°F (1.12°C) above a 1881-1910 baseline. Using this older period as a baseline gives a better indication of how much warming has taken place since the start of the industrial period. The 2015 Paris Climate Agreement aims to limit warming well below 2°C of that period.
The increase in atmospheric greenhouse gases, primarily carbon dioxide from the burning of fossil fuels, continues to drive this long-term warming trend. It is responsible for warming both the atmosphere and the oceans as greenhouse gas concentrations continue to grow. The December 2017 average concentration of carbon dioxide at the NOAA Mauna Loa site in Hawaii was 406.82 parts per million (ppm), an increase of 2.40 ppm from December 2016, and up from 314.67 ppm (29%) from December 1958, when records began there.
Methodology: Calculations of average annual global temperature are performed independently at NASA and NOAA. Small differences in their calculations arise as NASA’s calculations are extrapolated to account for polar locations with poor station coverage, while NOAA relies more heavily on the polar station data.