


Alerts
We use the CSI to produce alerts that inform the public about upcoming extreme heat that is influenced by climate change.
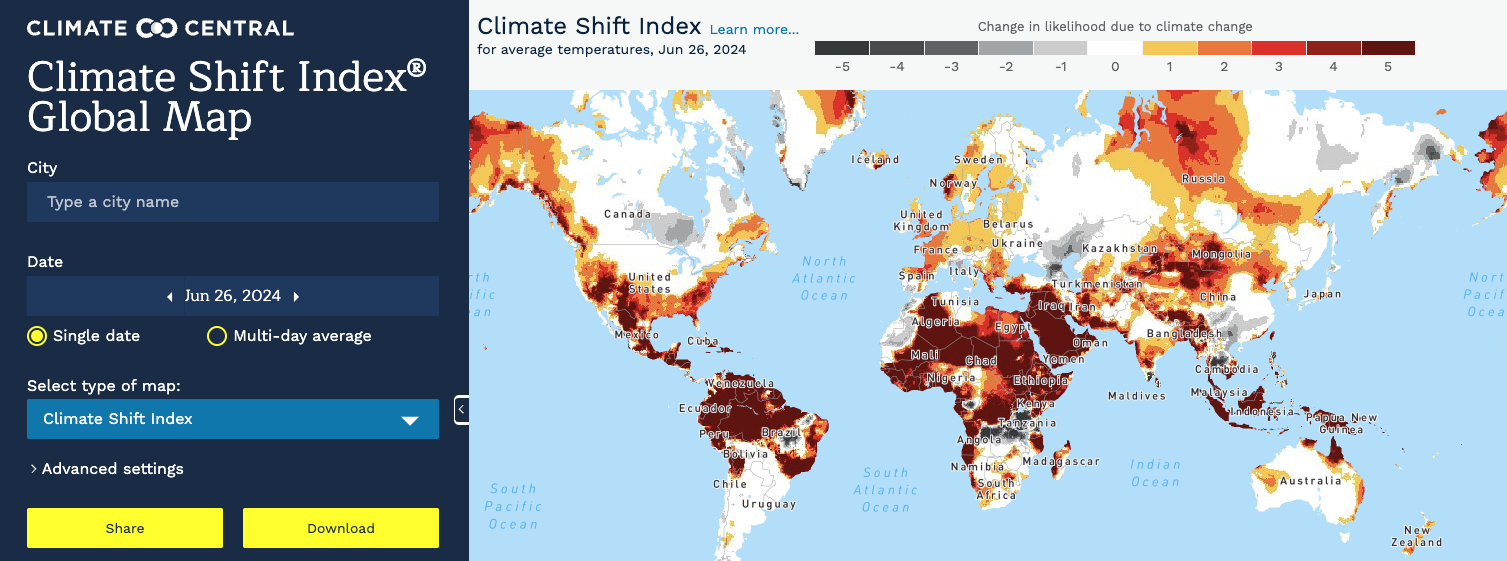
The Climate Shift Index® indicates how climate change has altered the frequency of daily temperatures in any location around the world, every day. It’s grounded in peer-reviewed attribution science and was launched by Climate Central in 2022.
We often hear how global average temperatures are increasing because of climate change, but people don’t experience global average temperatures. Instead, we mainly experience climate change through shifts in the daily temperatures and weather patterns where we live. Bridging this gap, the Climate Shift Index (CSI) is a system that quantifies the influence of climate change on local daily temperatures around the world.
The Climate Shift Index ranges from -5 to +5. Positive levels indicate temperatures that are becoming more likely due to climate change (negative scores indicate conditions that are becoming less likely).
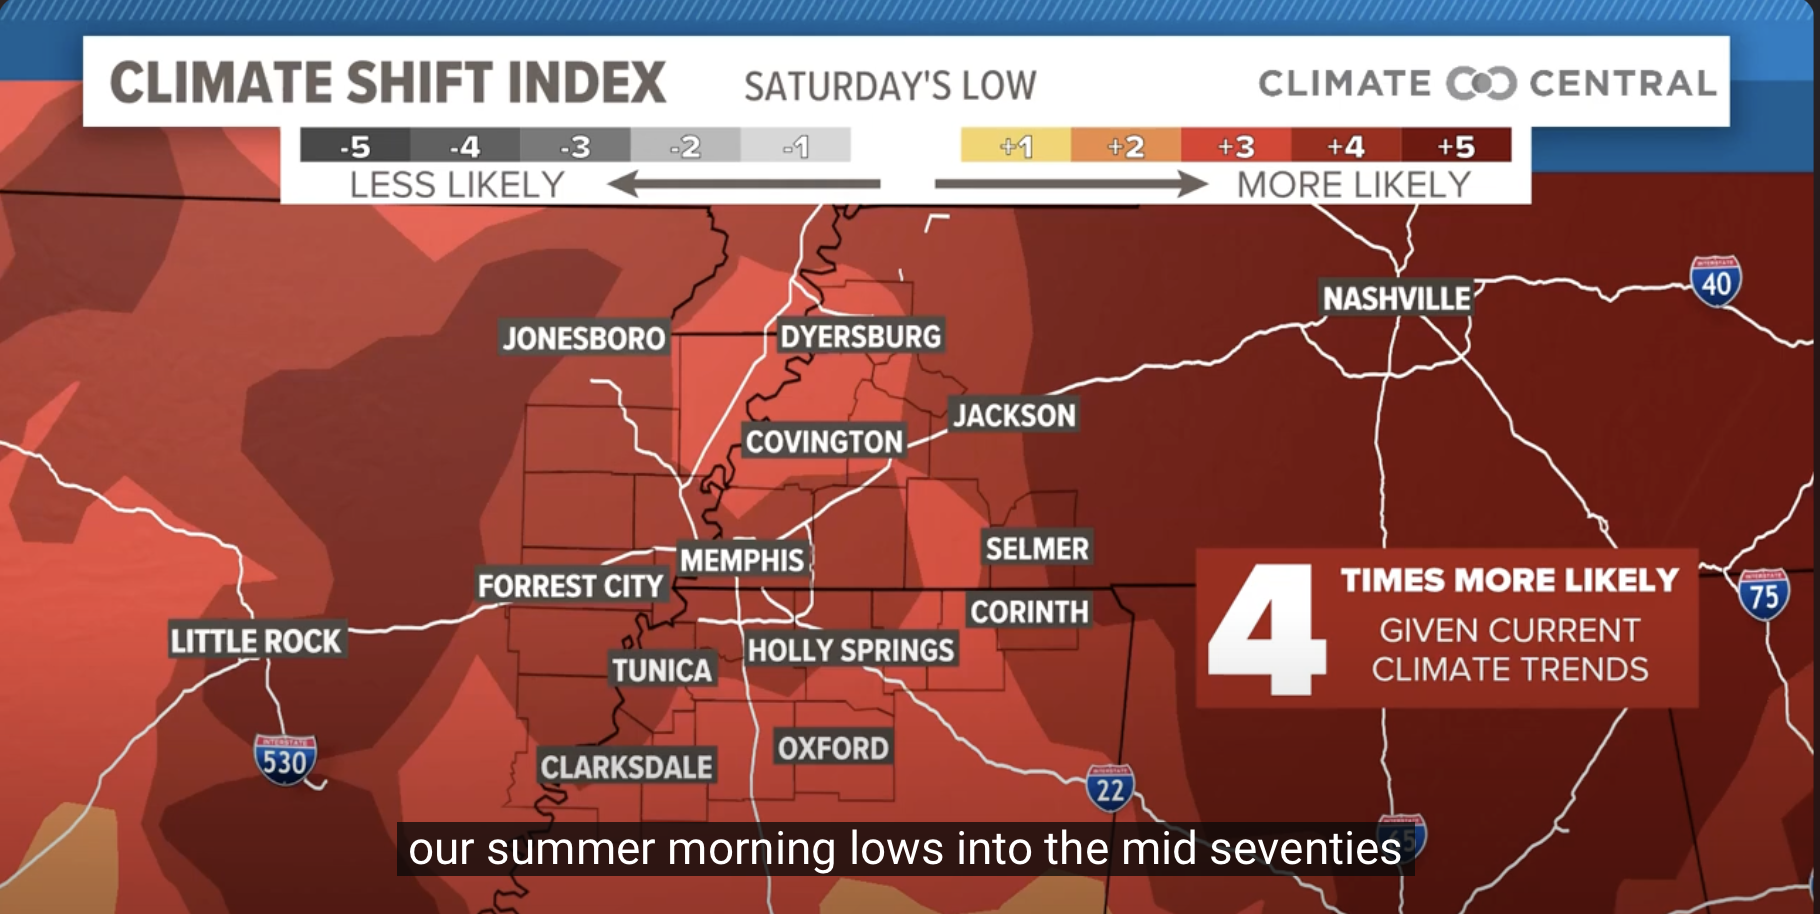
A CSI of level 5 means that a temperature is occurring at least 5 times more frequently when compared to a world without human-caused carbon pollution. This temperature would be very difficult to encounter in a world without climate change – not necessarily impossible, just highly unlikely. Similarly, a CSI level of 4 means the temperature is at least 4 times more likely, and so on. See the FAQ below for more details.
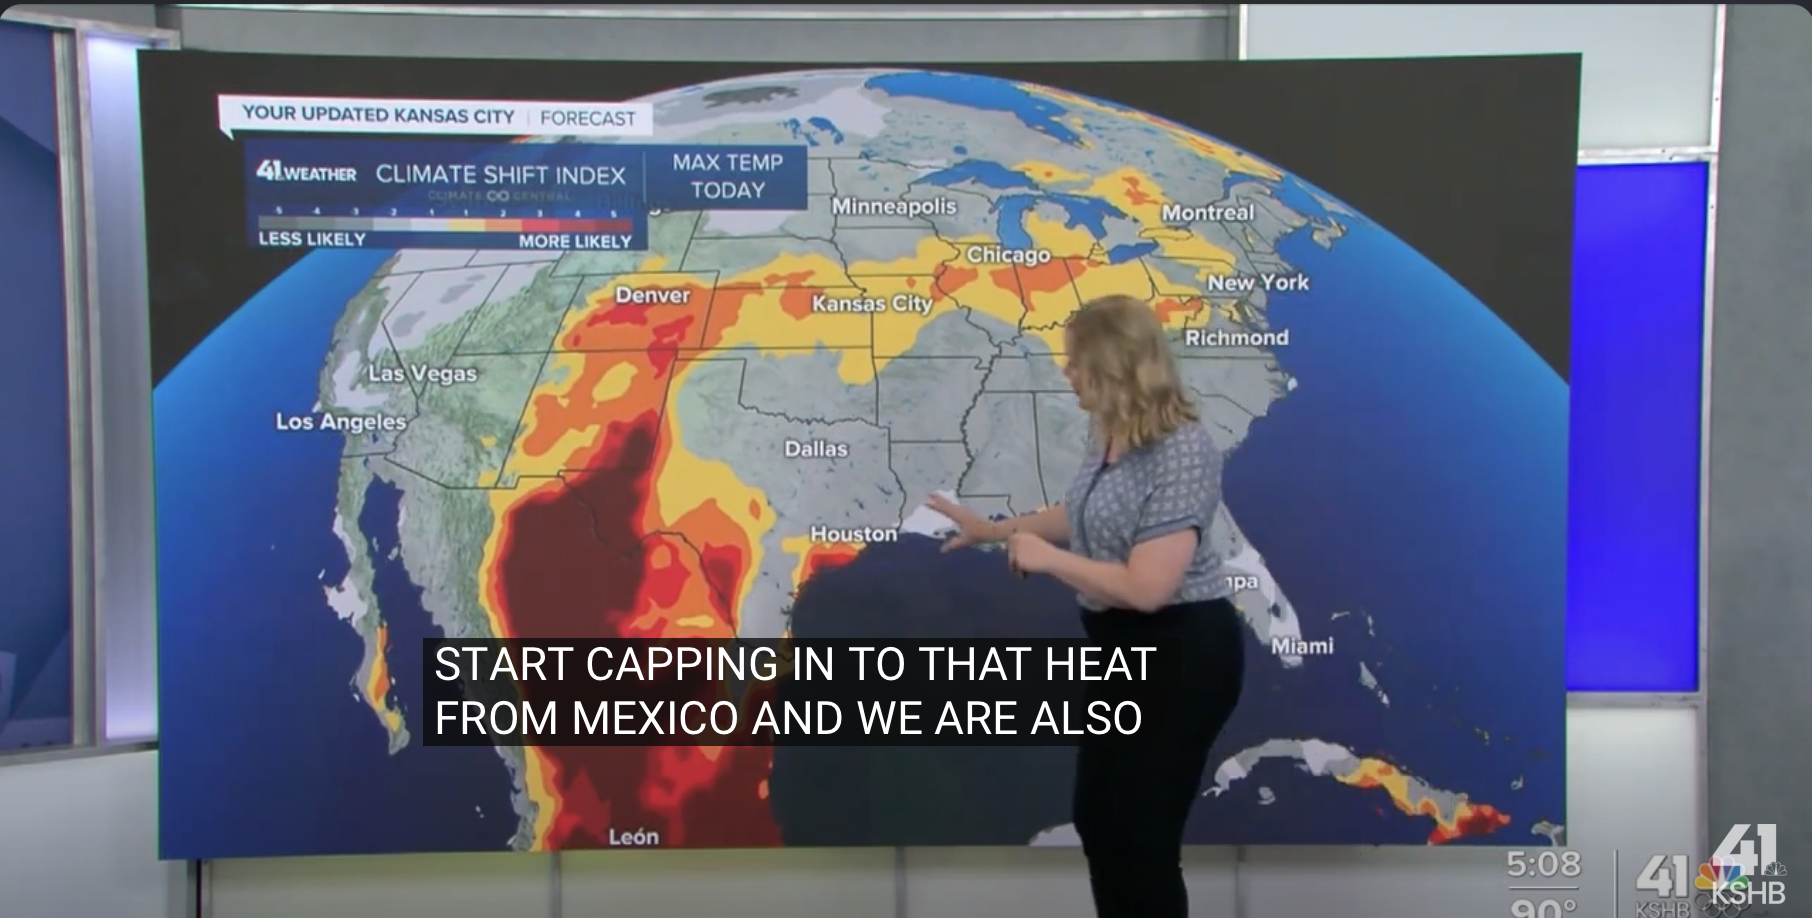
Whether you’re a meteorologist, journalist, policymaker, community leader, or engaged citizen, the Climate Shift Index gives you a way to connect climate change to weather events (like extreme heat and wildfires) and impacts (like school closures and health issues), locally and globally.
Use the CSI map tool (csi.climatecentral.org) to identify climate fingerprints in any location.
Download custom graphics directly from the map for TV, social media, presentations, reports, and more.
Sign up to get CSI data via KML files that you can add directly into a weather system.
Use any of the graphics below.
The methods beneath the calculation of the Climate Shift Index are detailed in A multi-method framework for global real-time climate attribution (June 2022). You can also find details of how we implemented these approaches to make a system that works every day, everywhere.
Read on for more detailed explanations of the science behind CSI.
To compute the Index, we average together two complementary ways of estimating how climate change has altered the frequency of a temperature. The first method uses 22 climate models each run with, and without, historical greenhouse gas emissions. We then calculate the frequency of the temperature in the modeled climates. This gives us 22 pairs of frequencies. We then take the ratio of the frequency in the runs with observed CO2 to the frequency in the run without extra greenhouse gasses. The second method calculates the frequency of daily temperatures for the past 30 years. We then calculate how much the temperature change of a particular location is in response to an increase in global mean temperature. This relationship allows us to remove the contribution of human-caused climate change, giving us the frequency of the particular temperature in a climate without global warming. We then compute the ratio of the frequency of the temperature in the current climate to the frequency in the climate without climate change. The final Climate Shift Index is built from the average of the observation-based and model-based estimates. For a full description of this method, refer to our technical documentation on the Climate Central Temperature Attribution System (CC-TAS).
The Climate Shift Index is a categorical scale, defined by the ratio of how common a temperature is in today’s altered climate vs. how common it would be in a climate without human-caused climate change. We built our system to work with temperatures that are observed most often. Level 5 events on our scale are exceptional events that are candidates for more detailed analysis, including the special statistical techniques necessary to work with extremely warm (or cold) temperatures beyond what has been observed. In 2021, 99% of the daily high temperatures in the U.S. had a CSI from -4 to 4. For the positive conditions (which occur much more often than the negative), we assigned a simple descriptor to these events (see scale image above).
Not quite. It’s a shift in how frequently certain temperatures occur. For example, suppose 90°F used to occur on average one day each year in June where you live. If climate change has altered the conditions so that 90°F now occurs on average three days each June, then its frequency (or likelihood) has increased by 3 times. Following this estimate, whenever we see a 90°F day in June in your location, it is assigned a value of 3.
Not entirely. Any weather event has multiple causes. The Index tells us how much climate change has boosted the odds of a particular temperature. Events where the Index reaches level 5 would be very difficult to encounter in a world without climate change–-not necessarily impossible, just very, very unlikely.
The goal of our system is not to recreate the climate of 1850 or some earlier period. Instead, the goal of our system is to calculate how human-caused climate change has altered the climate. There are lots of factors that can affect climate in a location. For example, turning a grassy field into a city can make higher temperatures more likely, while allowing trees to grow back will make warm conditions less likely. We want to include these effects but remove the effect of greenhouse gasses. We do this by characterizing today’s climate using the best available data and then using the model- and observation-based techniques described above to remove the effect of the extra greenhouse gasses released by humans.
Our main goal when creating the Climate Shift Index was to distinguish temperatures that have been influenced by climate change from conditions where that link is not firmly established. To make sure this is the case, if either of the two observation-based methods or the average of the model-based methods disagree on whether climate change played a role, then that event receives a value of 0. This means that for any event with a positive Index number, there is strong evidence that climate change has contributed to those temperatures.
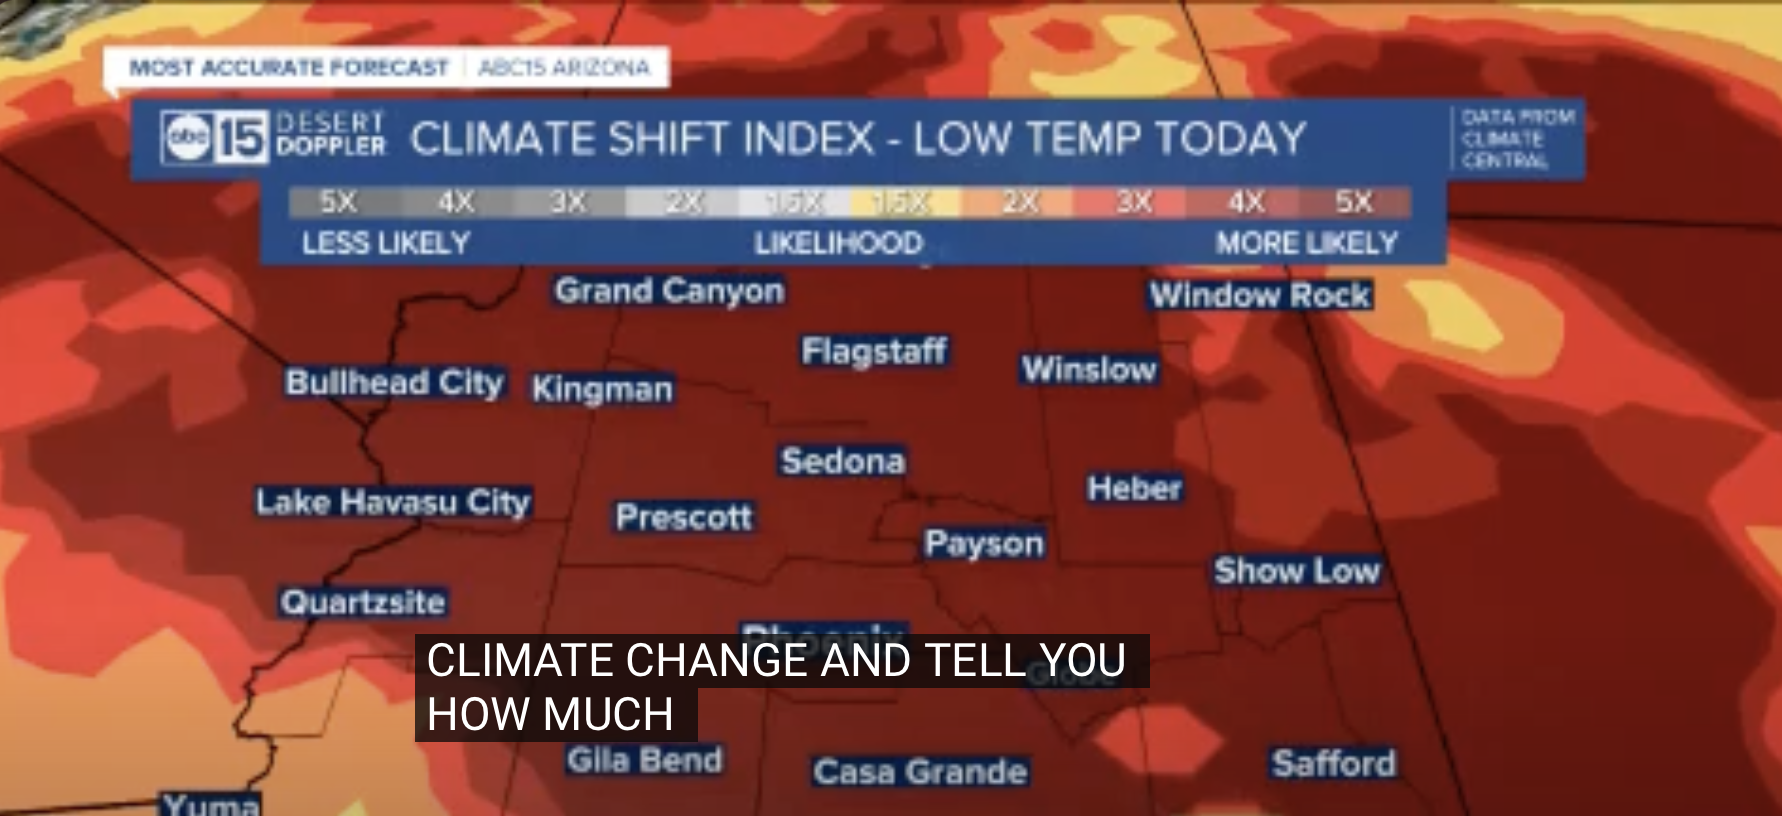
When talking about warming, it is natural to focus on the daytime high temperatures. However, climate change is also occurring at night and we see some of the strongest climate signals in these low temperatures. Elevated nighttime temperatures, especially during the summer, can create uncomfortable conditions and limit opportunities for people to cool down. Nighttime heat poses a health risk, especially for vulnerable populations such as the sick, elderly, and lower-income communities who may not have air conditioning. For people with air conditioning, elevated nighttime temperatures increases their utility bills.
While climate change is making hot days more likely, cold days still occur. The Index tells you that climate change is making these cooler days less likely. The Index is defined so that a temperature event with value of -2 means that it is two times less likely (equivalently, they occur half as often) due to climate change.
Yes! We can compute how climate change has reduced the frequency of cold conditions at a location; in fact, the math is exactly the same. Cooler temperatures are still observed in today’s warming climate, they just happen less often. During 2021, there were 44% more daily high temperature events with Climate Shift Index levels of 1 than -1. There were 180% more level 2 than -2 events and 812% more level 3 than -3 events.
Right now, we have only implemented our system for surface air temperature. We have good data on temperature and climate models do a good job simulating it. We are working to extend the Climate Shift Index to other meteorological and oceanographic variables.
The level of the Climate Shift Index depends on how the daily forecasted temperature compares to (1) the strength of the local climate warming trend and (2) the spread of possible local temperatures (what scientists call the variance). If the warming trend is weak, then Index levels will be close to zero even when temperatures are much higher or lower than normal. Similarly, places and seasons with a lot of variance require bigger temperature anomalies to produce detectable positive or negative Climate Shift Index levels. This applies in many places in the U.S., especially during the spring and fall. For the same reason, places with strong warming signals and low variance—such as tropical regions and many places near the ocean—can have large Climate Shift Index levels even for modest temperature departures from normal.
Climate Shift Index levels are evaluated each day using temperatures from a state-of-the-art numerical weather model. But discrepancies between daily forecasted temperatures and actual observed temperatures can lead to divergent attribution estimates. In particular, places and seasons with relatively small temperature variability combined with relatively strong temperature trends (e.g., the tropics, especially overnight) are likely to have greater sensitivity to differences between the forecast and observations. We account for these uncertainties by masking out regions where forecast errors could lead to a change in the Index of two levels (or greater), labeling them as “Currently unavailable.” Masked regions are filled when observational data become available.