Climate Matters•January 20, 2021
Winter's Coldest Time
KEY CONCEPTS
Much of the country is entering its coldest stretch of days. Differences in topography, latitude and proximity to large bodies of water all play a role in the climate of individual areas. However, due to climate change, the coldest days of winter are losing their chill.
Climate Central analyzed the average temperature on what is statistically the coldest stretch of days for 244 weather stations across the country, and how those temperatures have trended over the past fifty years. 83% of locations analyzed are losing their winter chill, especially in the Northeast, Southeast and Alaska.
Losing winter’s cold comes with important consequences. Warmer temperatures mean that more winter precipitation is falling as rain instead of snow—impacting the Northeast and mountainous Southeast regions where the economies of many smaller, rural communities depend on winter sports tourism.
In the West, a shrinking snowpack dries out the landscape and affects freshwater supplies for residential, commercial and agricultural uses. Agriculture is also impacted by warmer winters - diminishing fruit crop yields and favoring the survival of insect pests (including ticks and mosquitoes).

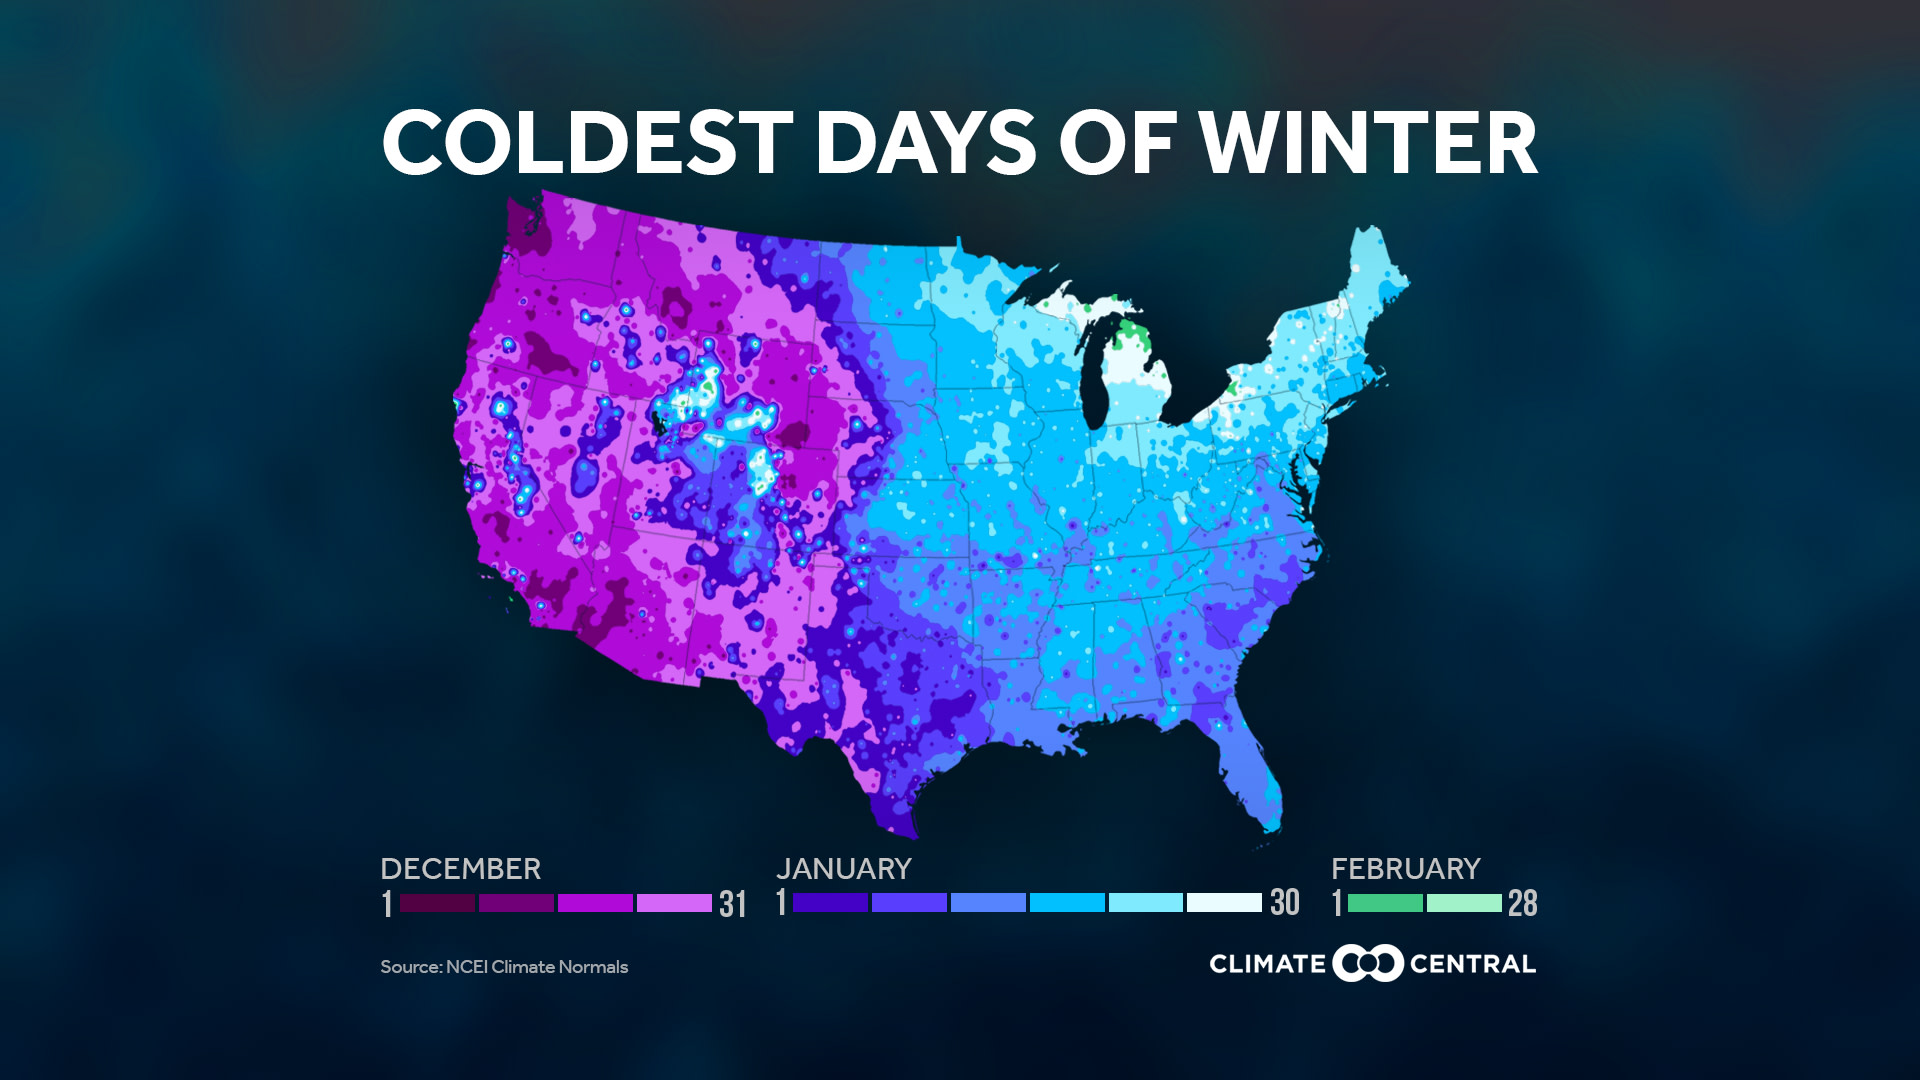
This is climatologically the coldest time of year for much of the country. The West usually has its coldest days early in the winter season. In the Southeast, the cold peak often comes a little later—early January—whereas in the Northeast and Great Lakes regions, the coldest days do not typically come until mid to late January. Differences in topography, latitude and proximity to large bodies of water all play a role in the climate of individual areas. However, due to climate change, the coldest days of winter are losing their chill across the country.
This week we analyzed 244 locations across the country, the average temperatures they recorded on what is their coldest period of days during the year, and how those temperatures have trended over the past fifty years. The coldest days are warming up for much of the country, especially in the Northeast, Southeast and Alaska. Overall, 83% (203) of the 244 cities analyzed recorded an increase in the average temperature of their coldest stretch of days. The cities with the largest increases are Juneau (15.4℉), Dothan (12.9℉), and Bluefield (12.5℉).
When the list of climate change impacts includes worsening wildfires, more frequent flooding and harder-hitting hurricanes, warming winters seems like one of the least intimidating. In fact, some folks may welcome warmer winters if they mean reduced heating bills, ice-free roads and, while we continue to face the pandemic, an easier way to socialize safely outside. However, losing winter cold does come with important consequences.
Warmer temperatures mean that more winter precipitation is falling as rain instead of snow—impacting the Northeast and ski areas in the mountainous Southeast in particular and posing an outsized threat to smaller, rural communities which depend on winter sports tourism. A report by Protect Our Winters found that winter recreation was worth $20.3 billion to the U.S. economy during the 2015-16 season, and that ‘low snow years’ meant as many as 17,400 lost jobs. The Climate Impact Lab found that climate change is expected to shrink the ski season by several weeks in the next two decades.
Drought has again spread across almost half of the contiguous U.S. It is particularly extreme in the western United States, where the shrinking snowpack dries out the landscape and affects freshwater supplies for residential, commercial and agricultural uses. Not only are farmers vulnerable to worsening drought conditions in some areas, but several important fruit crop yields are diminishing due to insufficient stretches of cold weather. Of further consequence to crop yields but also to human health is the persistence of insect pests, including ticks and mosquitoes. Mosquitoes are known to have a high mortality rate at temperatures below 50°F. In a recent analysis, we found that mosquito-friendly days are increasing at 64% of the sites analyzed across the country.
POTENTIAL LOCAL STORY ANGLES
What’s the snow forecast in your area?
The National Weather Service (NWS) has a Winter Weather Desk, which provides twice-daily updated forecasts for snow, freezing rain, and other wintry conditions around the country. You can find local information from your nearby NWS office here, and you can also see snow reports at specific ski resorts here.
Are warmer temperatures affecting agriculture in your area?
Several important fruit crops in the U.S. need an adequate chill period to produce a successful harvest. These crops—apples, peaches, cherries and blueberries—were worth over $4.8 billion to the U.S. economy in 2019. If these crops contribute to your state’s economy (find out in this USDA report), consider interviewing local farmers on the impacts of climate change that they’re experiencing. You can connect with farmers and regional USDA experts through the department’s regional climate hubs.
Is winter warming making pests worse in your area?
Winter is the fastest-warming season for most of the country — mostly the eastern United States. The CDC provides information on the presence of health threats from mosquitoes, ticks and vector-borne diseases in the U.S, as well as press kits for mosquitoes and ticks, including experts to contact.
LOCAL EXPERTS
The SciLine service, 500 Women Scientists or the press offices of local universities may be able to connect you with local scientists who have expertise on climate-related disasters in your area. The American Association of State Climatologists is a professional scientific organization composed of all 50 state climatologists.
NATIONAL EXPERTS
Dr. Sarah Kapnick
Deputy Division Leader & Research Physical Scientist
Seasonal to Decadal Variability and Predictability Division
NOAA, Geophysical Fluid Dynamics Laboratory
Expertise: Snowfall, snowpack variability, predictability, extremes, climate change
sarah.kapnick@noaa.govMario Molina, Protect Our Winters
Media Contact: Torrey Udall, torrey@protectourwinters.orgAhira Sánchez-Lugo, Physical Scientist, NOAA National Centers for Environmental Information (NCEI), Center for Weather and Climate (CWC), Ahira.Sanchez-Lugo@noaa.gov
*Available for interviews in Spanish and English
METHODOLOGY
The national map and each city’s “coldest days” period were developed by NCEI based on the 1981–2010 U.S. Climate Normals. For the time-series analysis, Climate Central analyzed the average temperature for the "coldest days" stretch using the Applied Climate Information System.