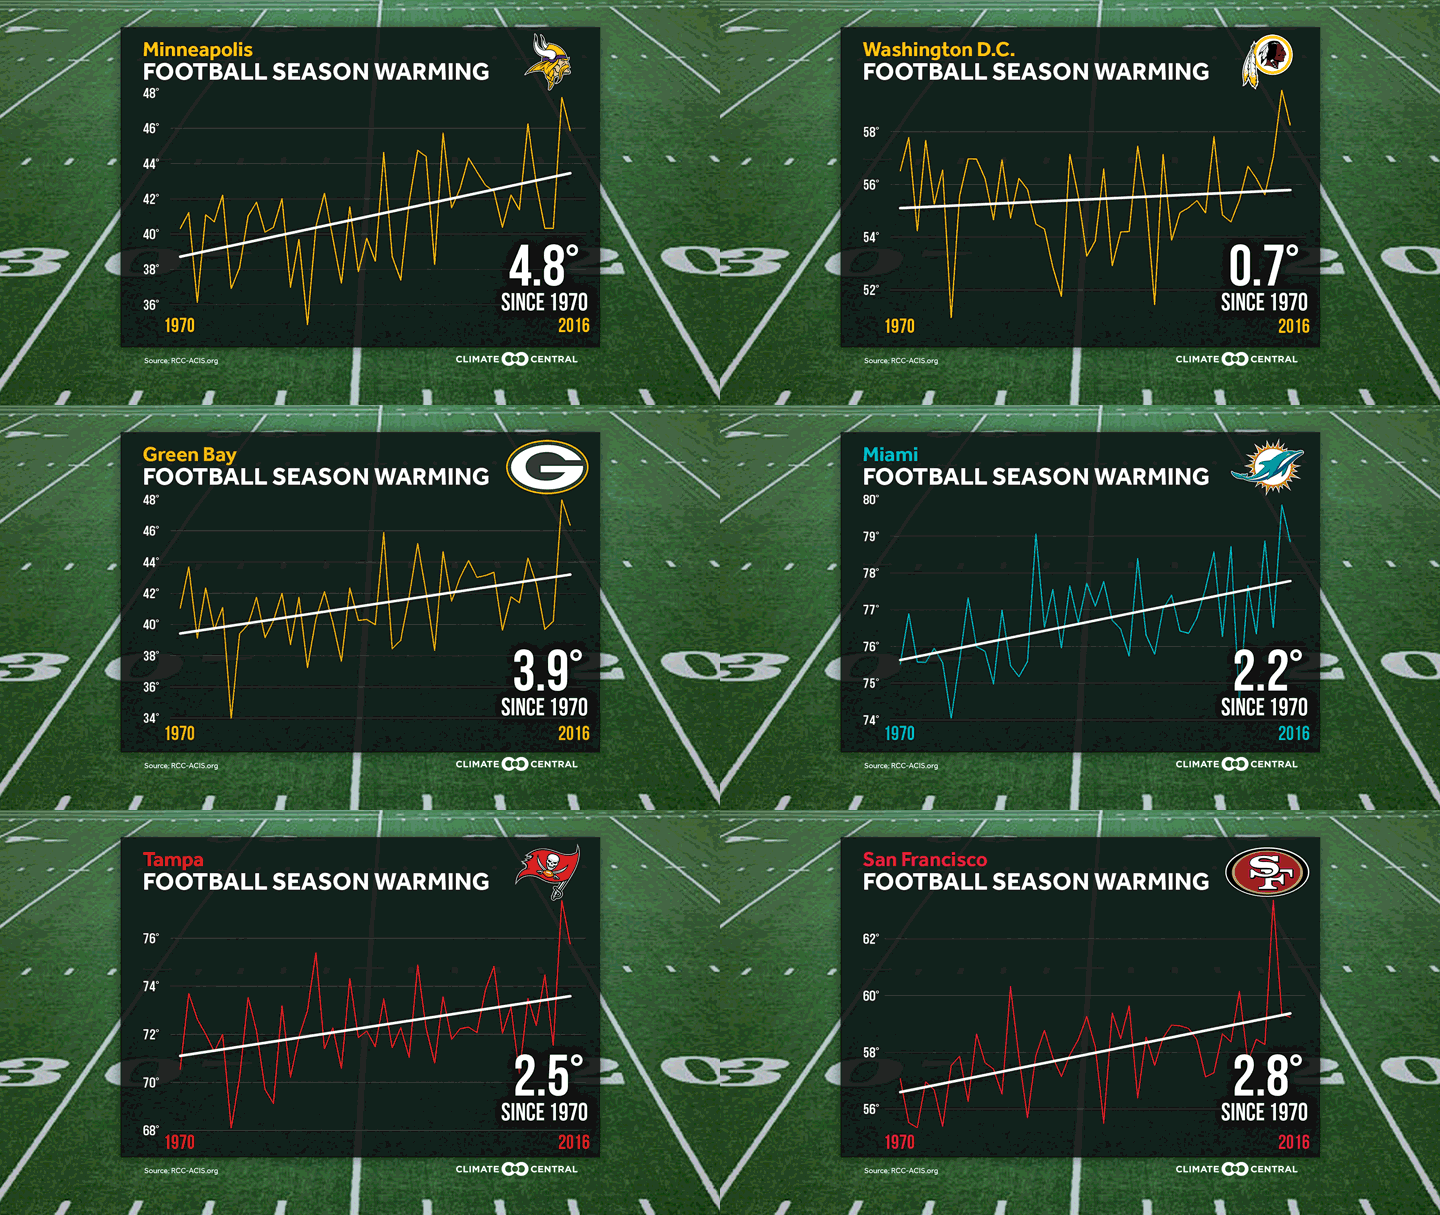
Football season is in full swing, but it’s just not as cold as it used to be. Just this past Sunday, Green Bay was 89°F at kickoff, the hottest home kickoff the Packers have had at Lambeau Field. Swaths of other football towns across the Northeast and Midwest had similarly sweltering conditions.
See the trend in temperatures for your favorite team here >>
This Sunday’s heat is a single data point, but our analysis reveals widespread warming in NFL cities. We examined the average temperature for each of the 30 NFL cities for September through December since 1970 and found that all of them are trending warmer.
Some of the cities in colder climates, such as Detroit, Green Bay, and Minneapolis have seen football season heat up more than 3°F since 1970. Minneapolis is the fastest-warming NFL city with temperatures 4.8°F warmer than in 1970. These results are in line with larger trends which indicate that colder climates are generally warming faster than warmer climates, particularly during the winter and fall.
But global warming isn’t just roughing the climate in northern cities. Football season in Houston, New Orleans, and Phoenix is also more than 3°F warmer than in 1970. While the mild weather may make for more pleasant December tailgates outside of enclosed stadiums, it could feel like football season is off to a false start for September games. Outdoor tailgates are hotter, and practices can take a greater toll on players.
For the teams going full throttle in outdoor stadiums, the increasing heat raises the risk of heat exhaustion and heat stroke. Relentless heat can also tire players out, raising the risk of injury. The heat is only likely to get more intense as the world warms, pointing to the reality that we can’t punt on addressing climate change.
METHODOLOGY: We computed the average temperature for the four month period September through December using the daily average temperature in each of the 30 NFL cities. The analysis goes back to 1970 because data is only complete for all cities through that time. We used temperature data from the largest city within each team’s coverage area in the analysis.
