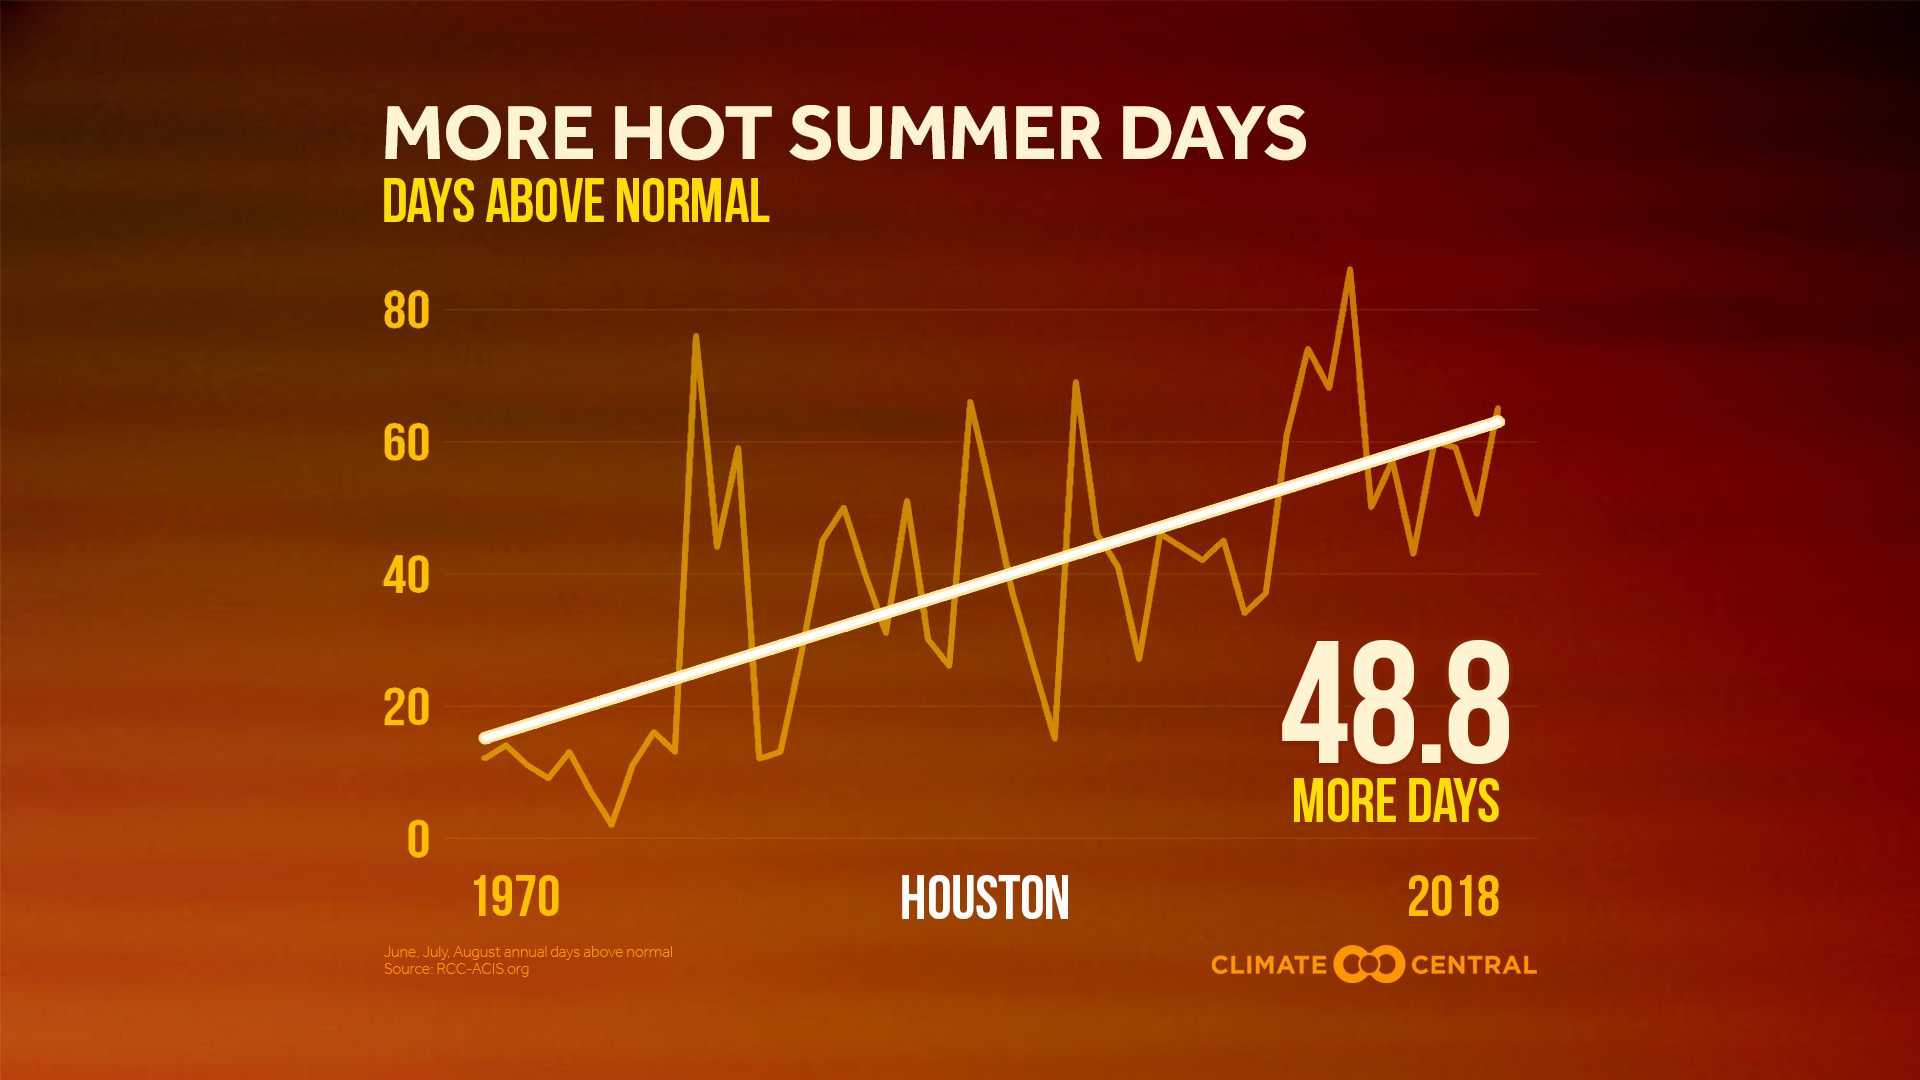
Global warming is increasing the number of summer days with above-normal temperatures — leading to more health risks from heat exhaustion and disease-carrying insects.
With meteorological summer underway, this week marks the second of two releases on summer heat. Last week’s release focused on summer average temperatures, finding that nearly all of the 244 cities analyzed have gotten hotter in the past half-century. Now, we move to the number of summer days above the 1981-2010 NOAA/NCEI climate normal — with similar results.
Almost 92% of the cities analyzed have experienced an increase in the number of above-normal summer days since 1970, with an average increase of 15 days. That’s more than two additional weeks with hotter-than-normal temperatures. 35 cities have recorded a rise of at least 30 hot days, or an additional month. McAllen, Texas leads the list with a remarkable increase of 64 hot days, followed by Houston (49 days), Laredo (47 days), and Sarasota, Florida (44 days). The largest changes are dominated by southern areas — of the top 20 cities, Las Vegas and Raleigh are the furthest north. Summer heat in the South is shifting from uncomfortable to downright unbearable.
In addition to last week’s featured impacts on agriculture, athletes, and air conditioning costs, hot summers can spur more disease-carrying insects and hurricane strength. A 2018 Climate Central report found that 94% of cities analyzed have experienced an increase in “disease danger days” — days that support the spread of vector-borne disease. And since 93% of the climate’s extra heat goes into the oceans, summer heat is strengthening hurricanes as well.
These impacts can be minimized by reducing the greenhouse gas emissions that are warming our climate. But we will almost certainly have to adapt — particularly in urban areas that are heating up faster. Heat action plans, with cooling centers and early warning systems, can help prepare residents for the worst. And while only part of the solution, trees and green infrastructure can keep cities cool in more ways than one.
Methodology: Graphics indicate the number of summer days (defined as June, July, and August) above the 1981-2010 NOAA/NCEI climate normal. For each month, we counted the number of days when the daily average temperature departure from normal is greater than zero.
Climate Central's local analyses include 244 stations. However, for data summaries based on linear trends, only 242 stations are included due to large data gaps in St. Johnsbury, Vermont and Wheeling, West Virginia. Due to inconsistencies outlined by NCEI, data from Reno, Nevada was excluded from the top city rankings.
