From breathtaking ice sculptures to the frozen pants challenge, people were buzzing around the polar outbreak in late January. But just five days later, few took notice when Chicago temperatures climbed to a record high minimum. With temperature swings of 70°F or more around the Midwest, concerns shifted to potholes and pipe bursts. These rapid thaws are yet another sign that winters are warming, as below-normal temperatures struggle to persist. This week, we find that human-caused climate change is making cold snaps shorter and rarer around the country.
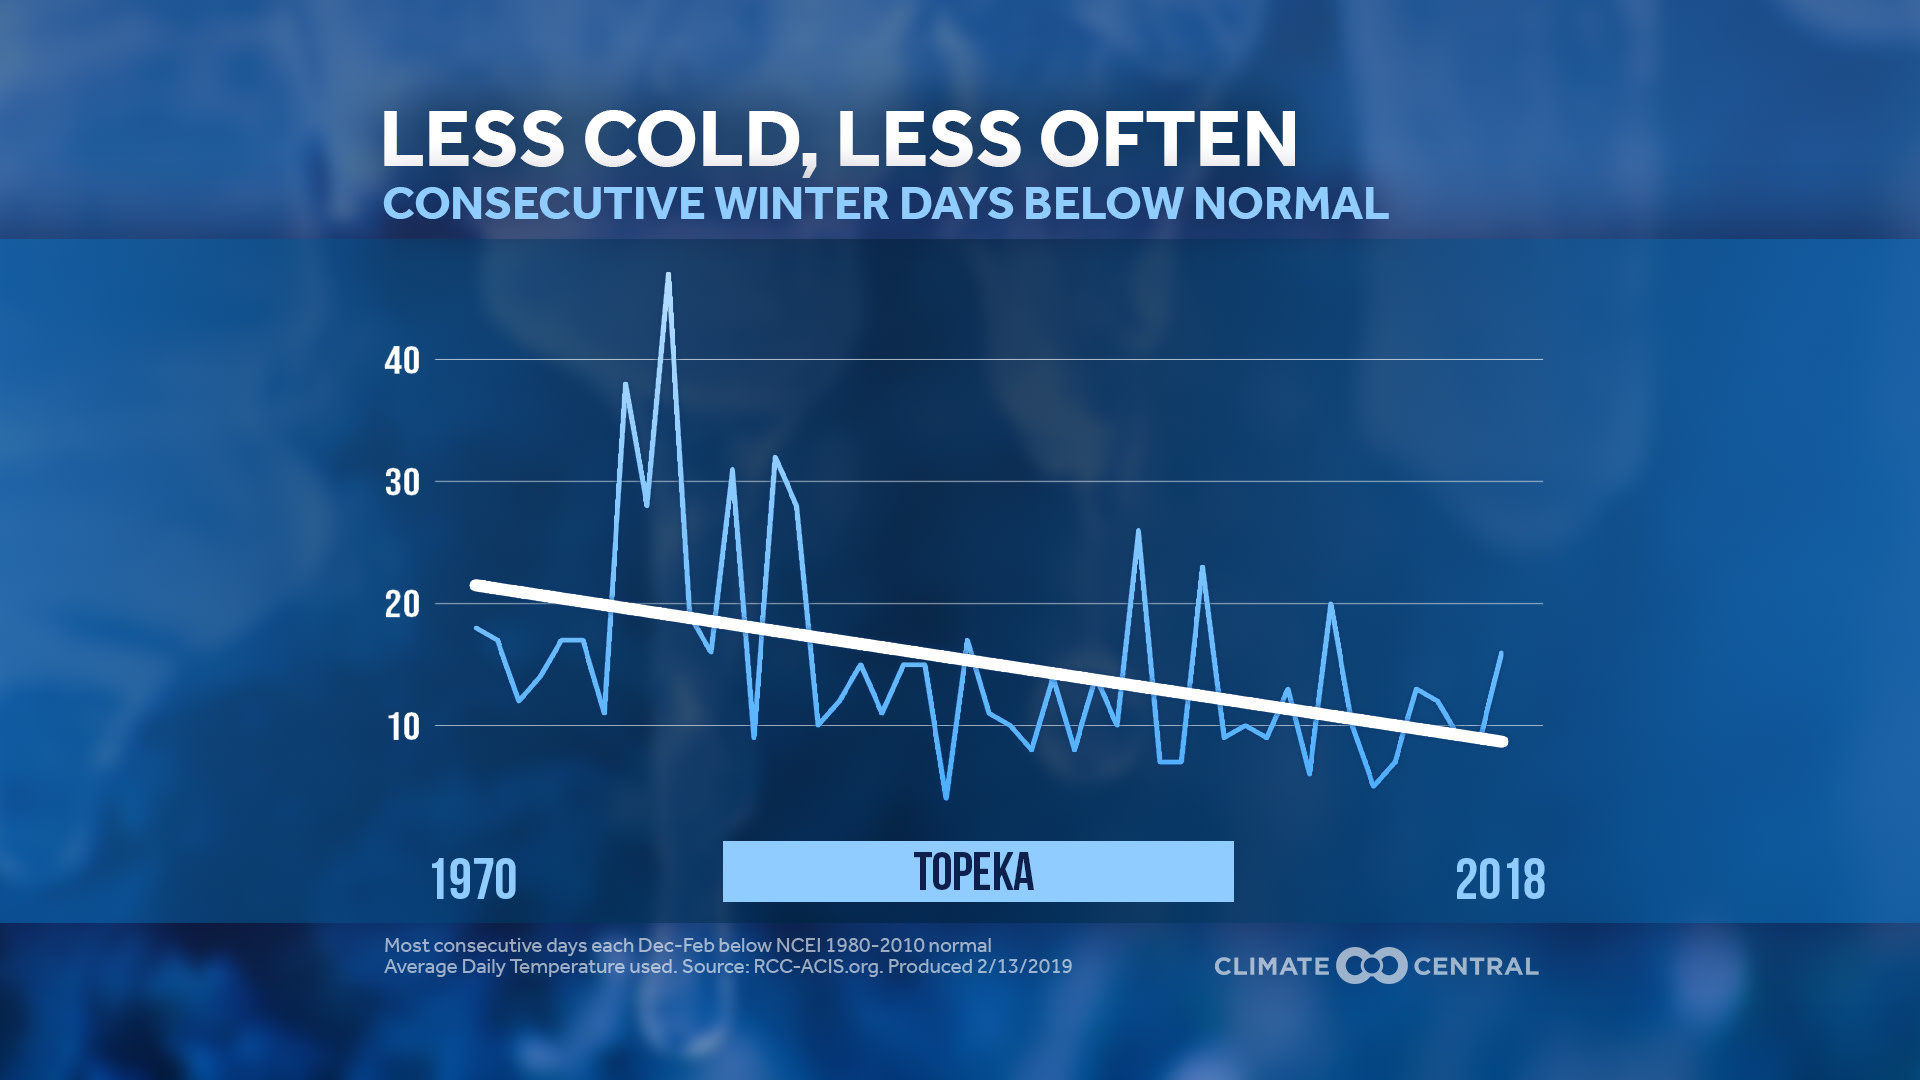
Since 1970, the longest annual streak of below-normal winter temperatures has gotten shorter in nearly all cities analyzed. Winter cold streaks trended at least one day shorter in 91 percent of our 244 cities, while trending at least one day longer in just two percent of cities. The average trend across cities was a reduction of nearly five days, with 45 locations seeing their cold streaks shorten by at least a week. Cities around the country — including Las Vegas, Topeka, St. Louis, and Philadelphia — were among those seeing the cold fade the most quickly.
These trends are affecting national industries that depend on consistent cold. Below-freezing temperatures are a must for winter recreation — an industry that contributed more than $20 billion to the national economy in the 2015-2016 season. According to Climate Impact Lab, every state in the contiguous U.S. will see fewer days with snow-friendly lows by midcentury, leading to quicker melts and shorter winter sports seasons. In less snowy places, fruit trees are suffering with less regular chilling time. Just two winters ago in the Southeast, a warm February caused peaches to bloom early, before a late-winter freeze led to $1 billion in crop damage. Warmer winters could even make those Valentine’s Day strawberries harder to come by — not to mention chocolate or champagne.
Methodology: Winter data (December, January, and February) was collected from the Applied Climate Information System. The graph indicates each year’s highest number of consecutive winter days below the 1981-2010 NOAA/NCEI climate normal. Displayed trend lines are based on a mathematical linear regression.
