Climate Matters•July 12, 2023
High Heat Index Days
KEY CONCEPTS
The risks of heat-related illness rise at heat index values of 90°F and above.
Since 1979, the annual frequency of days with a heat index of at least 90°F has increased in 201 U.S. locations analyzed by Climate Central—by 10 days on average.
Nearly one-quarter of these locations now experience at least 14 more annual high heat index days than in 1979.
The South, Southeast, Northwest, and Southwest have experienced the greatest increase in high heat index days.
Health risks rise with the heat index, but serious heat-related illness is preventable.
Humidity multiplies heat risks
Heat is the leading cause of weather-related fatalities in the U.S. Climate change is making bouts of extreme heat more frequent and intense.
When extreme heat and high humidity occur together, the health risks multiply. In humid heat conditions, we can suffer heat stress and illness, and the consequences can even be fatal.
The dangerous effects of humid heat are reflected in rates of heat-related illness across the U.S. this summer.
When it comes to heat, focusing on air temperature alone misses the changes in humidity—and underestimates how our warming planet affects our health and weather extremes.
The heat index: how hot it feels
Scientists and meteorologists use several different metrics of humid heat—the combination of high temperatures and humidity. The heat index is among the most common humid heat metrics (learn about other important metrics here).
The heat index (also known as the “apparent” or “feels like” temperature) is calculated using air temperature and relative humidity.
Relative humidity, expressed as a percent, is a measure of how much water vapor the air contains compared to the maximum it could contain at a given temperature.
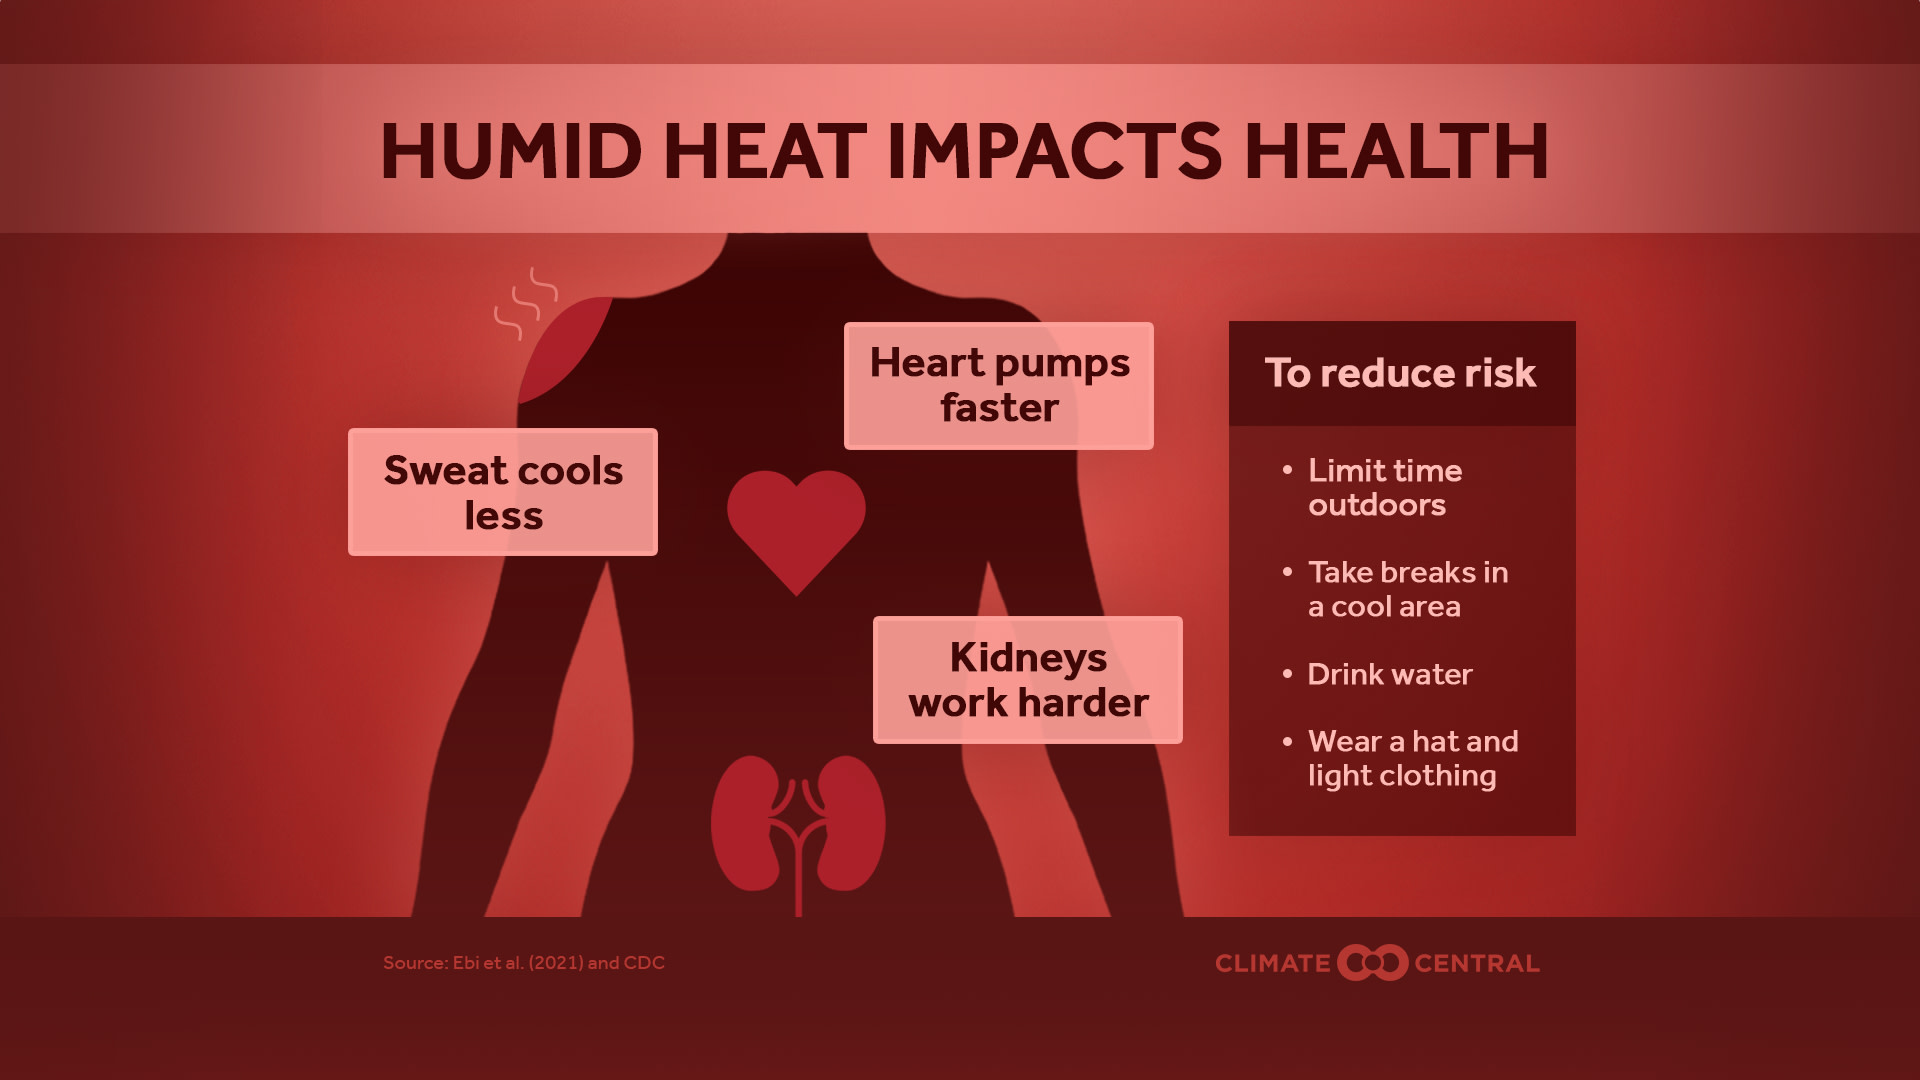
When air temperatures approach normal body temperature (around 98°F), high relative humidity levels limit the body’s main way to cool off: sweating.
The evaporation of sweat from skin cools our bodies. But as humidity rises, sweat evaporates more slowly and removes less heat from our bodies. As a result, our bodies “feel” hotter in humid heat.
Extreme levels of humid heat can overwhelm the body’s temperature control system and lead to serious and even fatal heat stress and illness.
Heat index values of 90°F and higher are increasingly dangerous. At these levels, sunstroke, heat cramps, and heat exhaustion become increasingly likely with prolonged exposure or physical activity.
Note that heat index values reflect what our bodies feel in the shade. Exposure to direct sunlight can increase “feels like” temperatures by up to 15°F.
More high heat index days in 201 U.S. locations
A new Climate Central analysis found that high heat index days are becoming more frequent across the U.S. as our climate warms.
Climate Central analyzed the change in the annual number of heat index days that “feel like” 90°F or higher in 239 contiguous U.S. locations from 1979 to 2022.
Since 1979, the annual number of days with a heat index of 90°F or higher has increased in 201 (84%) of the 239 locations analyzed.
These 201 locations now experience an average of 10 more high heat index days (at or above 90°F) compared to 1979, putting people at risk more often.
Nearly one-quarter of these 201 locations now experience 14 or more high heat index days each year than in 1979.
The South, Southeast, Northwest, and Southwest regions have experienced the greatest increase in the annual number of high heat index days since 1979.
The top six locations were all in the South or Southeast—specifically Texas, Florida, and Georgia:
McAllen, Texas (32 more days);
Miami and West Palm Beach, Fla. (30 and 27 more days, respectively);
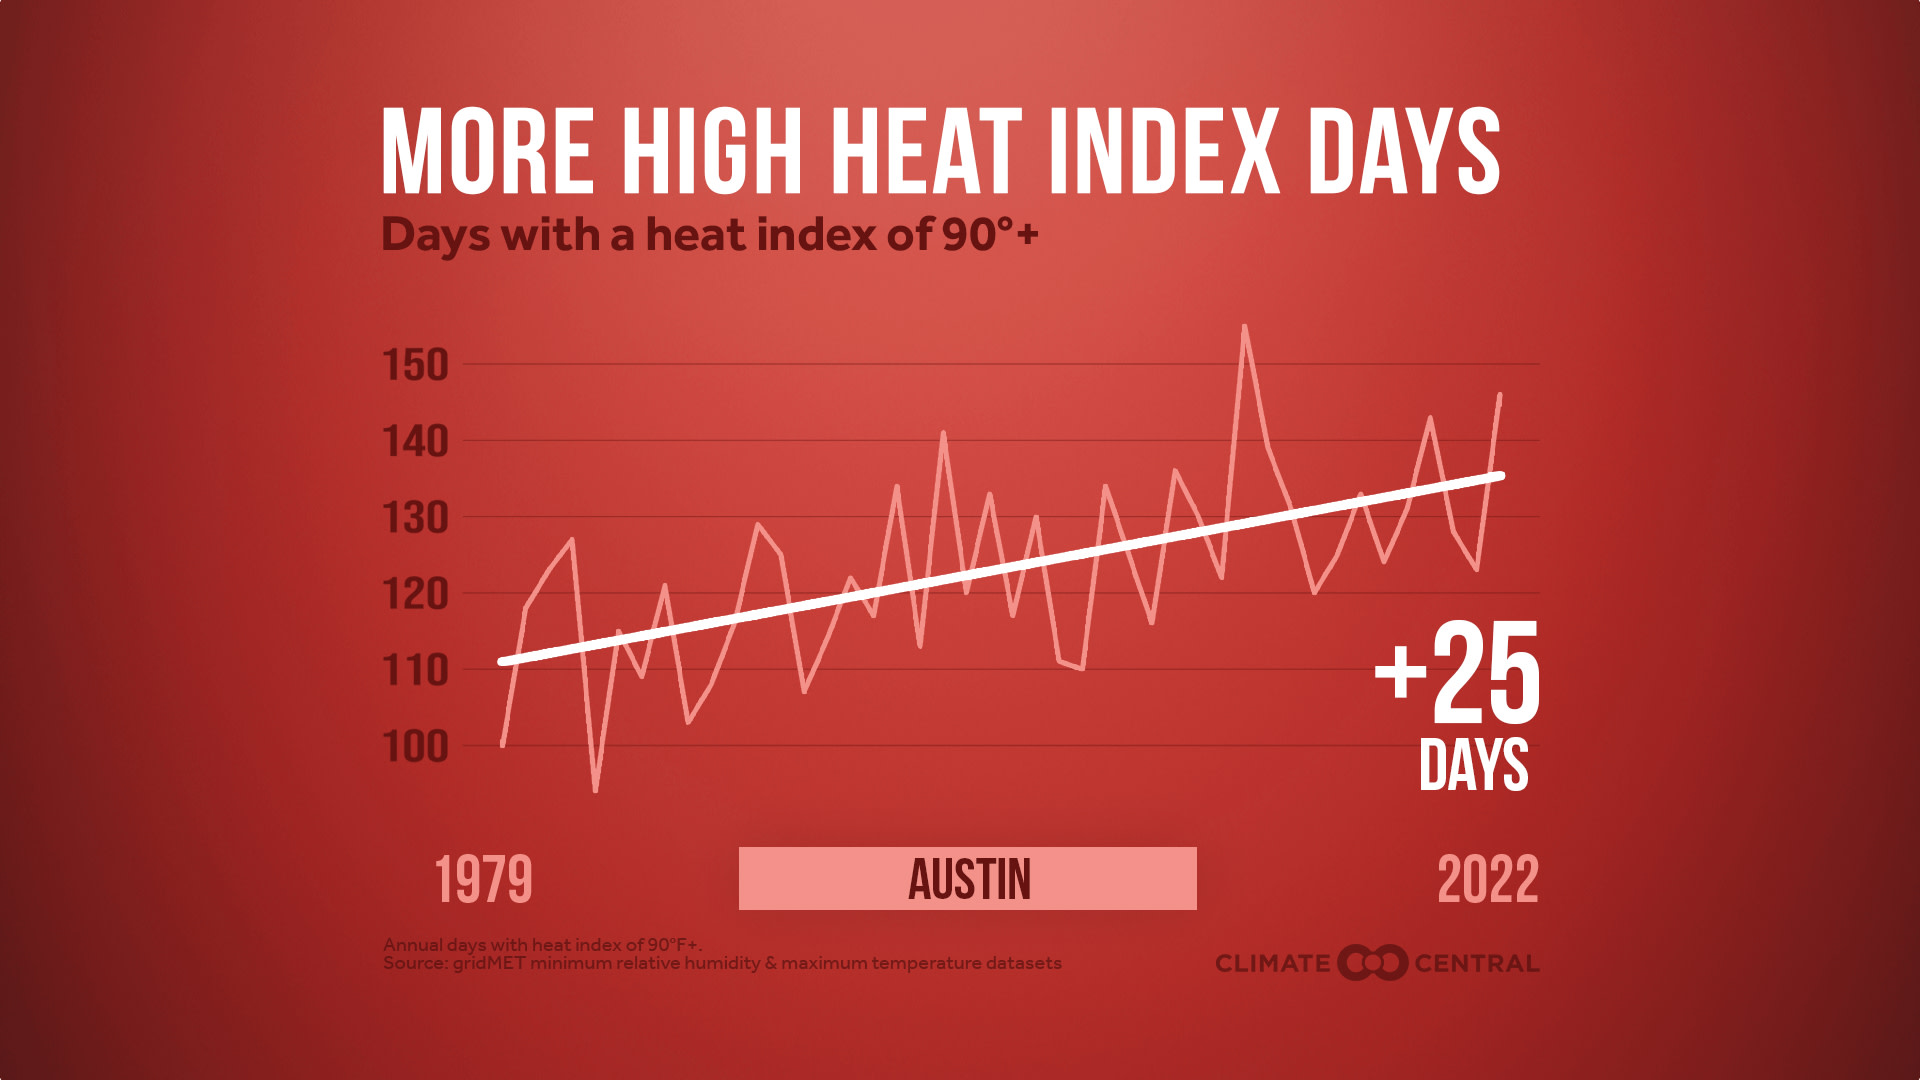
Austin, Texas (25 more days);
Savannah, Ga. (25 more days);
and San Angelo, Texas (24 more days).
Explore Climate Central’s Heat and Hospitalizations brief for a closer look at how the heat index during peak heat-related hospitalizations varies across U.S. climate regions.
Heat-related illness is serious, but preventable
When the heat index is high and the body cannot cool itself efficiently, a range of heat-related illnesses can occur.
Heat exhaustion symptoms include dizziness, heavy sweating, nausea, and weakness due to prolonged or strenuous exposure to hot, humid conditions. Heat exhaustion can be treated by moving to a cooler location, and drinking water. If untreated, heat exhaustion can lead to heat stroke.
Heat stroke is a life-threatening condition requiring emergency medical treatment. A victim of heat stroke may experience confusion, dizziness, or become unconscious due to a rapid rise in body temperature to dangerous levels.
Heat stress and related illnesses are preventable with proper planning and preparation.
Heat risks unequally shared
Extreme heat and humid heat can affect everyone, but some face greater risks of heat-related illness and mortality. There are many effective ways to protect at-risk populations from extreme heat.
Children, adults over 65, pregnant people, low-income communities, and people living with illness are particularly vulnerable to heat-related illness.
Outdoor workers and athletes are also at elevated risk due to work- and recreation-related exposure to extreme heat.
Structural inequities can also lead to higher heat exposure in some communities. According to a recent study, people of color and people living below the poverty line are disproportionately exposed to urban heat island intensity in 169 of the largest U.S. cities.
LOCAL STORY ANGLES
What is the current and future heat index in your area?
Monitor the National Weather Service active heat alerts and heat index forecast for the contiguous U.S., Alaska, Hawaii, Guam, Puerto Rico. The Weather Prediction Center also provides 3–7 day heat index forecasts for the contiguous U.S. Use a report and interactive tool from the Union of Concerned Scientists to explore how the annual frequency of high heat index days across the U.S. could change this century under different warming scenarios.
How to prepare and respond to humid heat
The Centers for Disease Control and Prevention provides warning signs and symptoms as well as guidance on ways to protect at-risk populations from heat-related health risks. The National Integrated Heat Health Information System advises on how to plan and prepare for extreme heat. The Department of Labor lists heat illness prevention measures for workers and employers.
How is extreme heat affecting public health near you?
The Centers for Disease Control and Prevention Heat and Health Tracker maps heat-related illnesses at the census-tract level in real time. Use the National Integrated Heat Health Information System (NIHHIS) Heat Equity Mapper to find census tracts in your area with the highest heat burden. Check the U.S. Department of Health and Human Services monthly Climate and Health Outlook for extreme heat outlooks in your region throughout the summer.
CONTACT EXPERTS
Luis E. Ortiz, PhD
Assistant Professor
Department of Atmospheric, Oceanic, and Earth Sciences
George Mason University
Related expertise: urban heat waves
Contact: lortizur@gmu.edu
*Available for interviews in English and Spanish
Gredia Huerta-Montañez, MD, FAAP
Senior Principal Research Scientist, Northeastern University
President, Puerto Rico Chapter of American Academy of Pediatrics
Related expertise: Climate change impacts on pediatric health
Contact: grediamd@gmail.com
*Available for interviews in Spanish and English
John Balbus, MD, MPH (he/him)
Acting Director
U.S. Department of Health and Human Services Office of Climate Change and Health Equity
Relevant expertise: health impacts of extreme heat
Contact: john.balbus@hhs.gov
FIND EXPERTS
Submit a request to SciLine from the American Association for the Advancement of Science or to the Climate Data Concierge from Columbia University. These free services rapidly connect journalists to relevant scientific experts.
Browse maps of climate experts and services at regional NOAA, USDA, and Department of the Interior offices.
Explore databases such as 500 Women Scientists, BIPOC Climate and Energy Justice PhDs, and Diverse Sources to find and amplify diverse expert voices.
Reach out to your State Climate Office or the nearest Land-Grant University to connect with scientists, educators, and extension staff in your local area.
METHODOLOGY
The daily maximum temperature and minimum relative humidity was assessed from 1979 to 2022 at 239 contiguous U.S. stations typically analyzed by Climate Central, using the gridMET modeled dataset and based on the findings of Dahl et al. (2019). Heat index temperatures were calculated using the National Weather Service’s heat index algorithms. The change in the annual number of days with a heat index of 90°F or higher is based on linear regression. Local graphics were not produced for three stations (Eureka and Monterey, Calif. and Flagstaff, Ariz.) because each had two or fewer total days with a heat index value of 90°F or higher during the period of analysis. Three additional stations (San Francisco, Santa Maria, and Salinas, Calif.) lacked sufficient data over the period of analysis to calculate a linear regression.