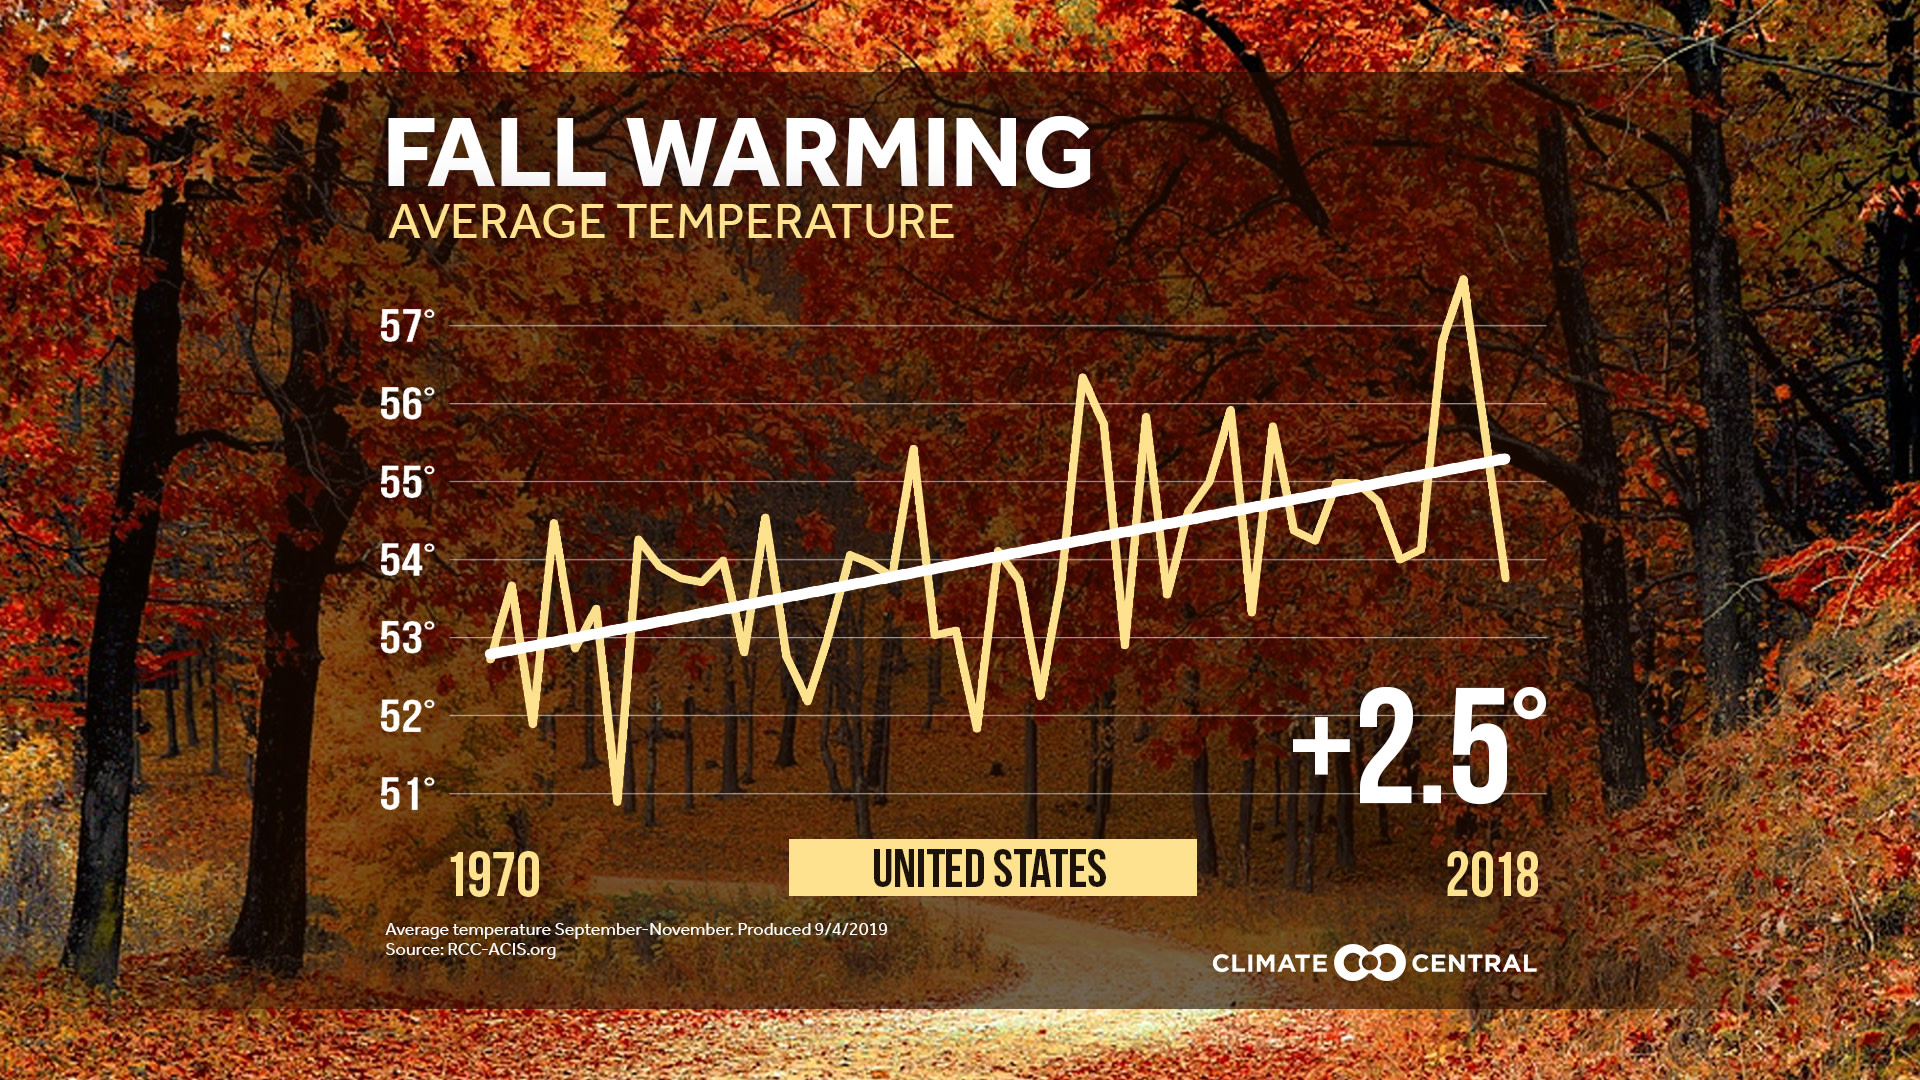
Fall is getting warmer for most of the United States, resulting in drawn-out mosquito and allergy seasons, and continued energy demands for cooling.
Of the 244 cities analyzed, 95% (229) recorded an increase—with more than half experiencing a rise of 2°F or more. The seven highest increases have all come in the western U.S.—led by Reno, Nevada (7.7°F), Las Vegas, Nevada (5.9°F), and El Paso, Texas (5.4°F). Fall has been the fastest warming season in Idaho, Wyoming, Colorado, New Mexico and Texas.
Summers are stretching further into the meteorological fall season—with the last characteristically hot day of summer occurring later in the year for many areas. As a result, energy demands for cooling (and the ensuing air conditioning costs) remain high, and warm-season woes such as allergies, mosquitoes and ticks linger longer. Additionally, important natural events such as bird migration, hibernation and fruit ripening are occurring ‘off schedule’, with the extent of these impacts on ecosystem health and biodiversity not yet fully understood.
A warmer, drier fall could also mean a longer wildfire season—a frightening prospect in light of recent and ongoing blazes in the Amazon basin, central Africa and Siberia, as well as a dozen U.S. states from Texas to Alaska. These conditions could also worsen air quality, exacerbating air stagnation issues (particularly in the western United States). Such impacts will only become more apparent as long as humanity’s greenhouse gas emissions continue unabated.
METHODOLOGY:The national trend in fall temperatures are from NOAA/NCEI Climate at a Glance for September through November. Individual city temperature trends are calculated using data from the Applied Climate Information System for the same period. Displayed trend lines on city analyses are based on a mathematical linear regression.
Climate Central's local analyses include 244 stations. However, for data summaries based on linear trends, only 242 stations are included due to large data gaps in St. Johnsbury, Vermont and Wheeling, West Virginia.
