Climate Matters•January 8, 2021
2020 US Temps & Billion-Dollar Disasters

KEY CONCEPTS
The numbers are in and 2020 was the 5th hottest year on record for the United States. Looking at the top 10 hottest years on record in the U.S., 6 have occurred since the year 2000, with the top 5 years all occurring since 2012.
Despite reports of temporary dips in emissions early on in the pandemic, greenhouse gas concentrations in the atmosphere continued to rise as they have since the industrial revolution (due to the burning of fossil fuels), with CO2 concentrations reaching an all-time high of 417ppm in May.
The warming trend in U.S (and indeed global) temperatures doesn’t just mean the smashing of high temperature records and alteration of seasonal patterns, it triggers a host of other changes in our climate and often makes extreme weather events both more frequent and more intense.
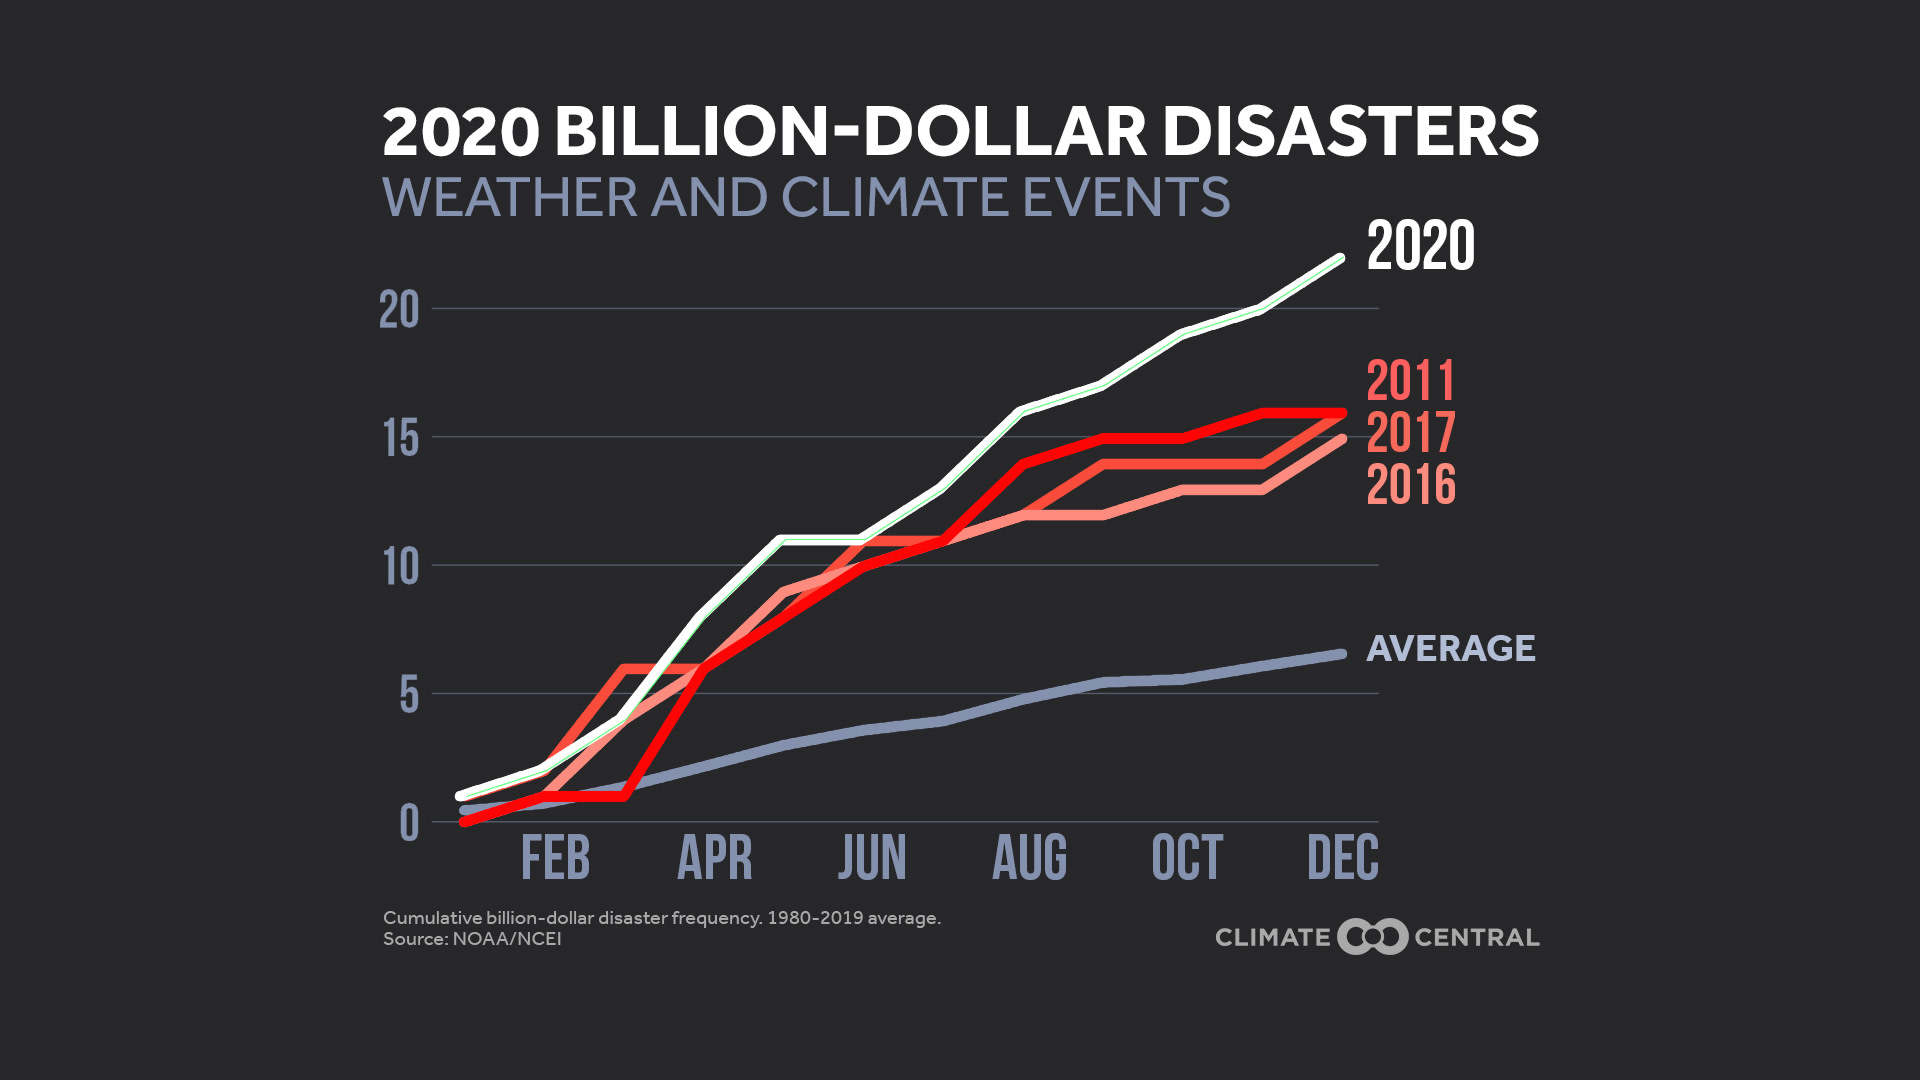
The U.S. experienced 22 billion-dollar disasters last year, costing us a total of $95 billion dollars. The severe impacts of climate change aren’t something we can leave in 2020, and making meaningful and sustained cuts in CO2 emissions is a significant challenge that’s still before us.
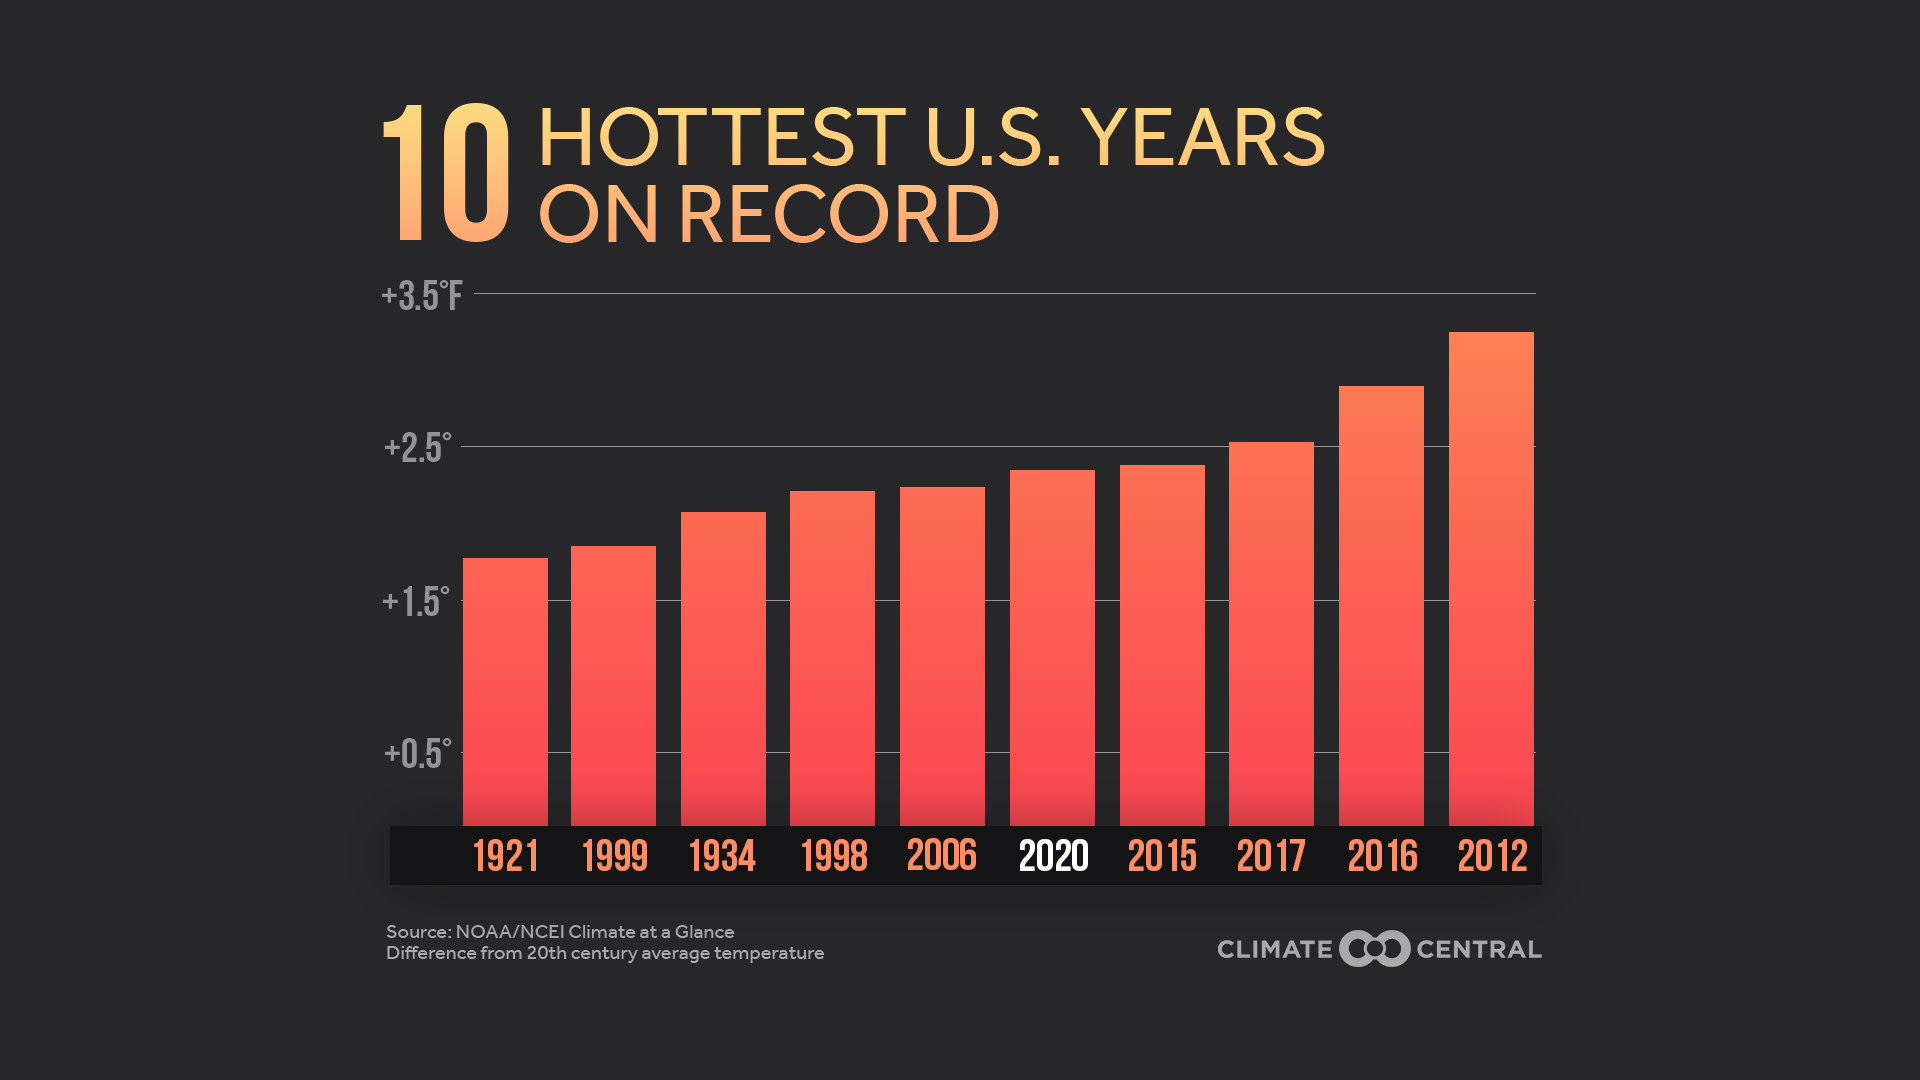
The numbers are in and 2020 was the 5th hottest year on record for the United States. Looking at the top 10 hottest years on record in the U.S., 6 have occurred since the year 2000, with the top 5 years all occurring since 2012.
Despite reports of temporary dips in emissions early on in the pandemic, greenhouse gas concentrations in the atmosphere continued to rise as they have since the industrial revolution (due to the burning of fossil fuels), with CO2 concentrations reaching an all-time high of 417ppm in May. The warming trend in U.S (and indeed global) temperatures doesn’t just mean the smashing of high temperature records and alteration of seasonal patterns, it triggers a host of other changes in our climate and often makes extreme weather events both more frequent and more intense.
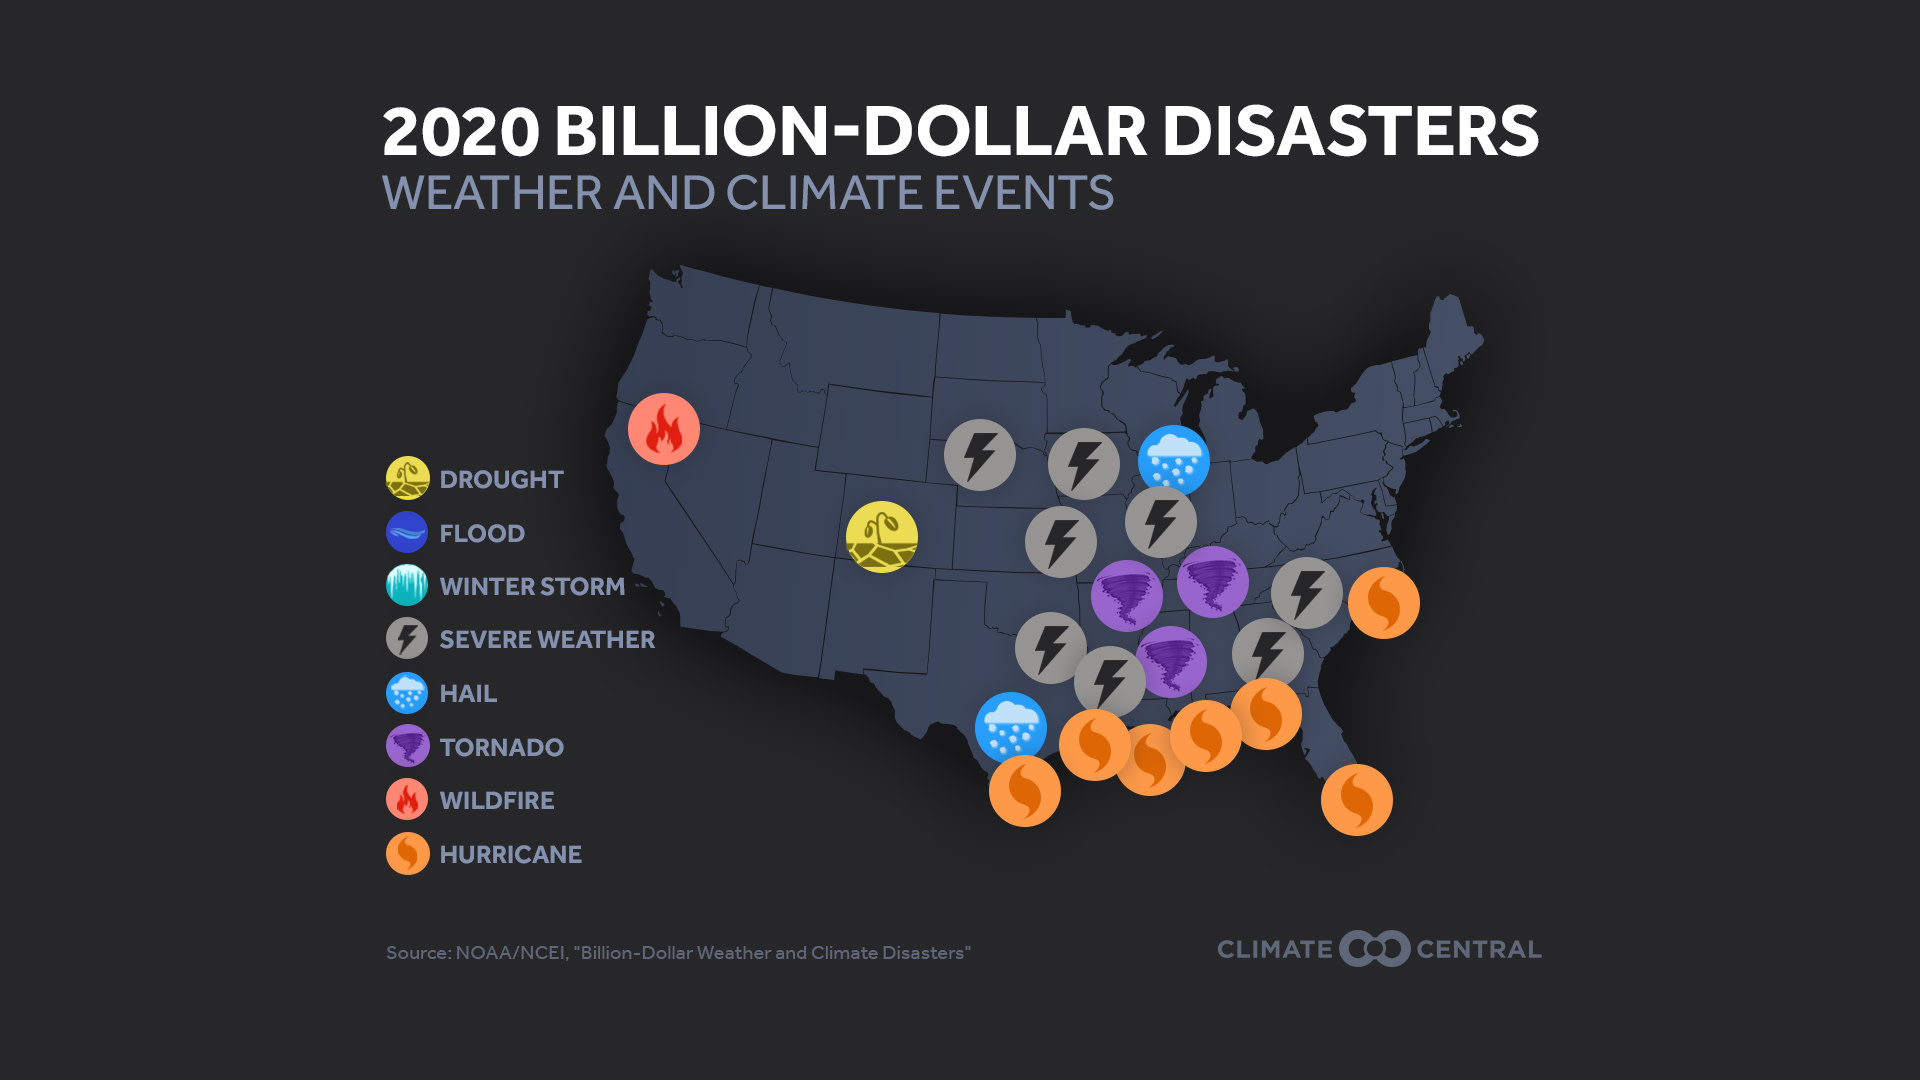
A warmer atmosphere holds more moisture which alters rainfall patterns and increases precipitation extremes, either leading to heavier downpours and more flooding, or increased evaporation from the soil. Much of the U.S dried out rapidly in 2020, which contributed to severe drought conditions in the western United States and record-breaking wildfires.
Warming air, land and ice only account for the 7% of the excess heat that our planet is experiencing. Oceans absorb the remaining 93% of heat energy, which causes global sea levels to rise and adds fuel to tropical storms. The 2020 hurricane season was a hyperactive one: the U.S. was pummelled by six hurricanes, all of which resulted in damages exceeding a billion dollars each.
These are just some of the reasons that we’re glad to leave 2020 behind, with COVID-19 vaccines and a rejoining of the Paris Climate Agreement as bright spots for the year ahead. However, the severe impacts of climate change will follow us into this new year, and ‘bending the curve’ on CO2 emissions is a significant challenge that’s still before us.
NOAA just updated their data on last year’s billion dollar disasters. On their site you can find:
2020 summary statistics, as well as previous time period comparisons
Interactive chart mapping billion-dollar disaster events over time since 1980, with regional and state-level options
Background information about each billion-dollar disaster event
Frequently Asked Questions about the dataset
Look out for our upcoming coverage of the global temperature rankings, which are scheduled to be published on Jan 14th, 2021. In addition, NASA and NOAA scientists will be available via satellite for one-on-one interviews in both English and Spanish on Friday, January 15 between 6am and 1pm ET to discuss the global temperature analyses. More information and a sign-up form can be found at this link.
POTENTIAL LOCAL STORY ANGLES
Did your state experience a billion-dollar disaster last year?
You can find summary statistics for your state here, for this year’s billion-dollar disasters and data collected since 1980. You can also find state-level graphics for the number of billion-dollar disaster events by decade.
Tools for reporting on extreme weather events and disasters near you:
Check out our extreme weather toolkits to learn more about the extreme weather your community experiences and the connections to climate change. A number of journalism schools and organizations provide advice for responsibly reporting on disasters, including focusing on safety, data, and cultural sensitivity. You can find preparedness materials for hurricanes, flooding, and other health emergencies at the Centers for Disease Control and Prevention (CDC). In addition, you can uncover more information about extreme weather events through SciLine’s multiple fact sheets.
LOCAL EXPERTS
The National Voluntary Organization Active in Disasters (VOAD) is an association of organizations that seeks to mitigate and alleviate the impacts of disasters in communities. You can find your state’s VOAD website, where you can discover state organizers as well as local member organizations. You can also find your local Emergency Management Agency through the FEMA website, as well as Community Emergency Response Teams (CERT) in your area.
The SciLine service, 500 Women Scientists or the press offices of local universities may be able to connect you with local scientists who have expertise on climate-related disasters in your area. The American Association of State Climatologists is a professional scientific organization composed of all 50 state climatologists.
NATIONAL EXPERTS
Adam Smith, Applied Climatologist, Center for Weather and Climate, National Centers for Environmental Information (NCEI). Lead scientist for NOAA’s U.S. Billion-dollar Weather and Climate Disasters research, analysis and public/private data partnerships (www.ncdc.noaa.gov/billions).
Karin Gleason, Meteorologist - Monitoring Section, NOAA's National Centers for Environmental Information (NCEI), Center for Weather and Climate (CWC), Karin.L.Gleason@noaa.gov
METHODOLOGY
Data source for Billion Dollar Disasters: NOAA National Centers for Environmental Information (NCEI) U.S. Billion-Dollar Weather and Climate Disasters (2020). https://www.ncdc.noaa.gov/billions/, DOI: 10.25921/stkw-7w73. The cost has been adjusted for inflation using the Consumer Price Index (CPI). The methodology developed by NOAA NCEI, with input from economic experts and consultants to remove biases, can be found at https://www.ncdc.noaa.gov/billions/overview. Additional review of the methodology can be found in Smith and Katz, 2013. For even more context, see FAQ here. Data source for temperature rankings: NOAA National Centers for Environmental Information (NCEI).