Climate Matters•May 12, 2021
Yearly Carbon Dioxide Peak
KEY CONCEPTS
Carbon dioxide (CO2) and temperature go hand in hand. The more CO2 we pump into the atmosphere, the more our planet warms.
Once emitted, much CO2 remains in the atmosphere for hundreds to thousands of years, making it a powerful influence on the long-term warming trend.
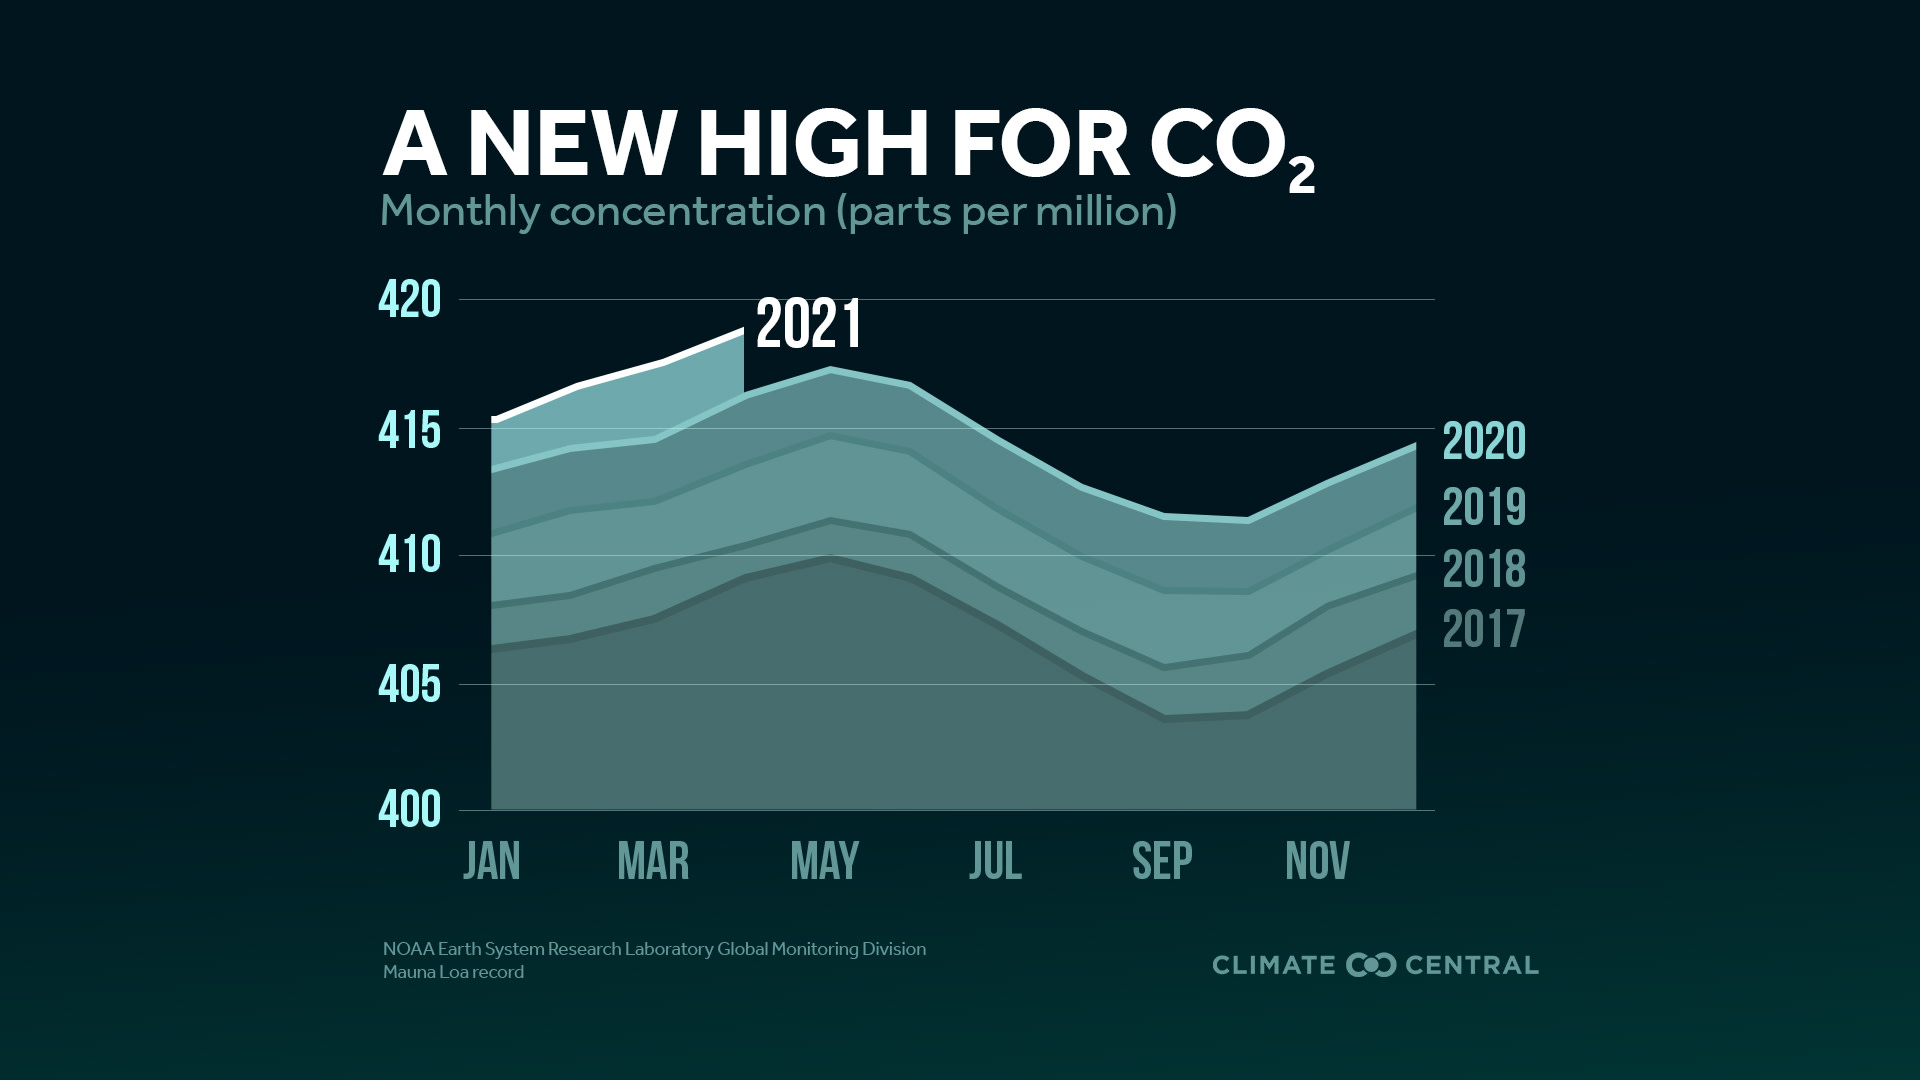
According to data from NOAA, daily peak CO2 reached just over 421 ppm (parts per million), up from 417 ppm last year at Mauna Loa.
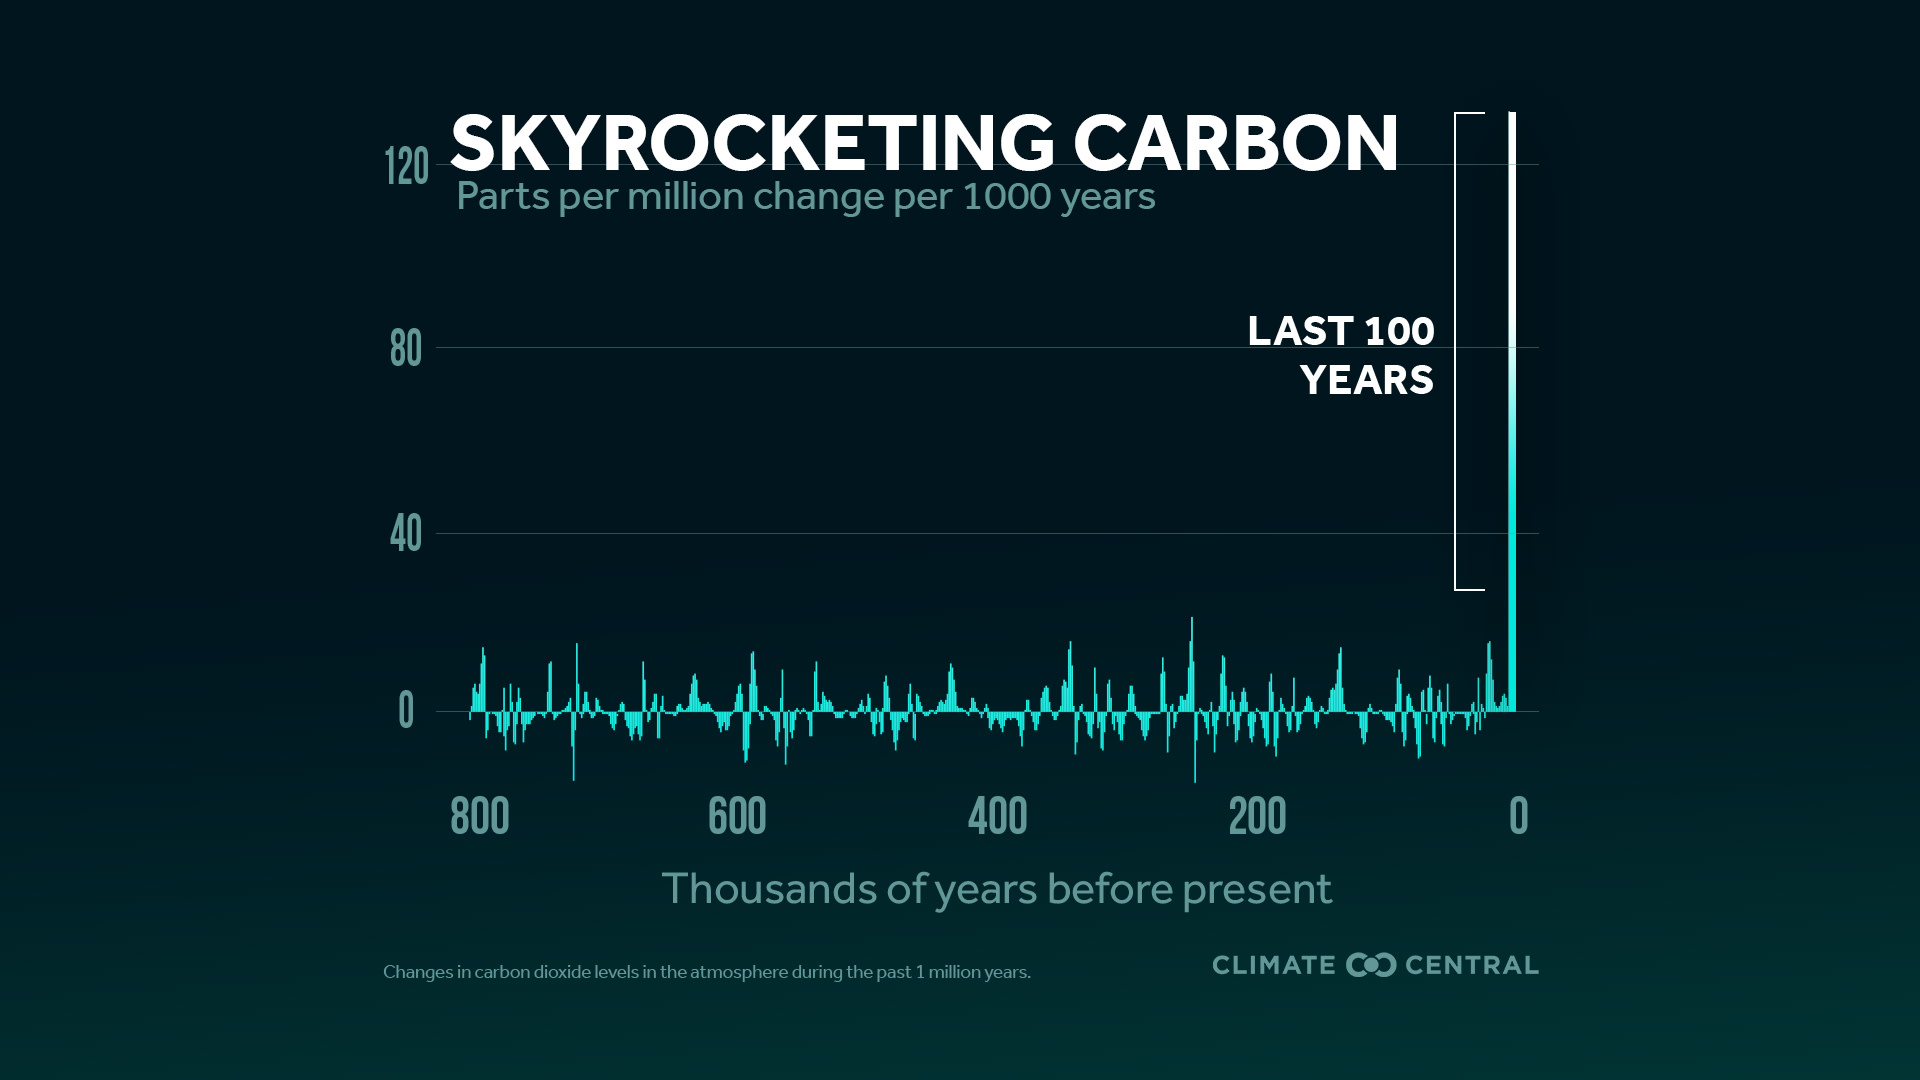
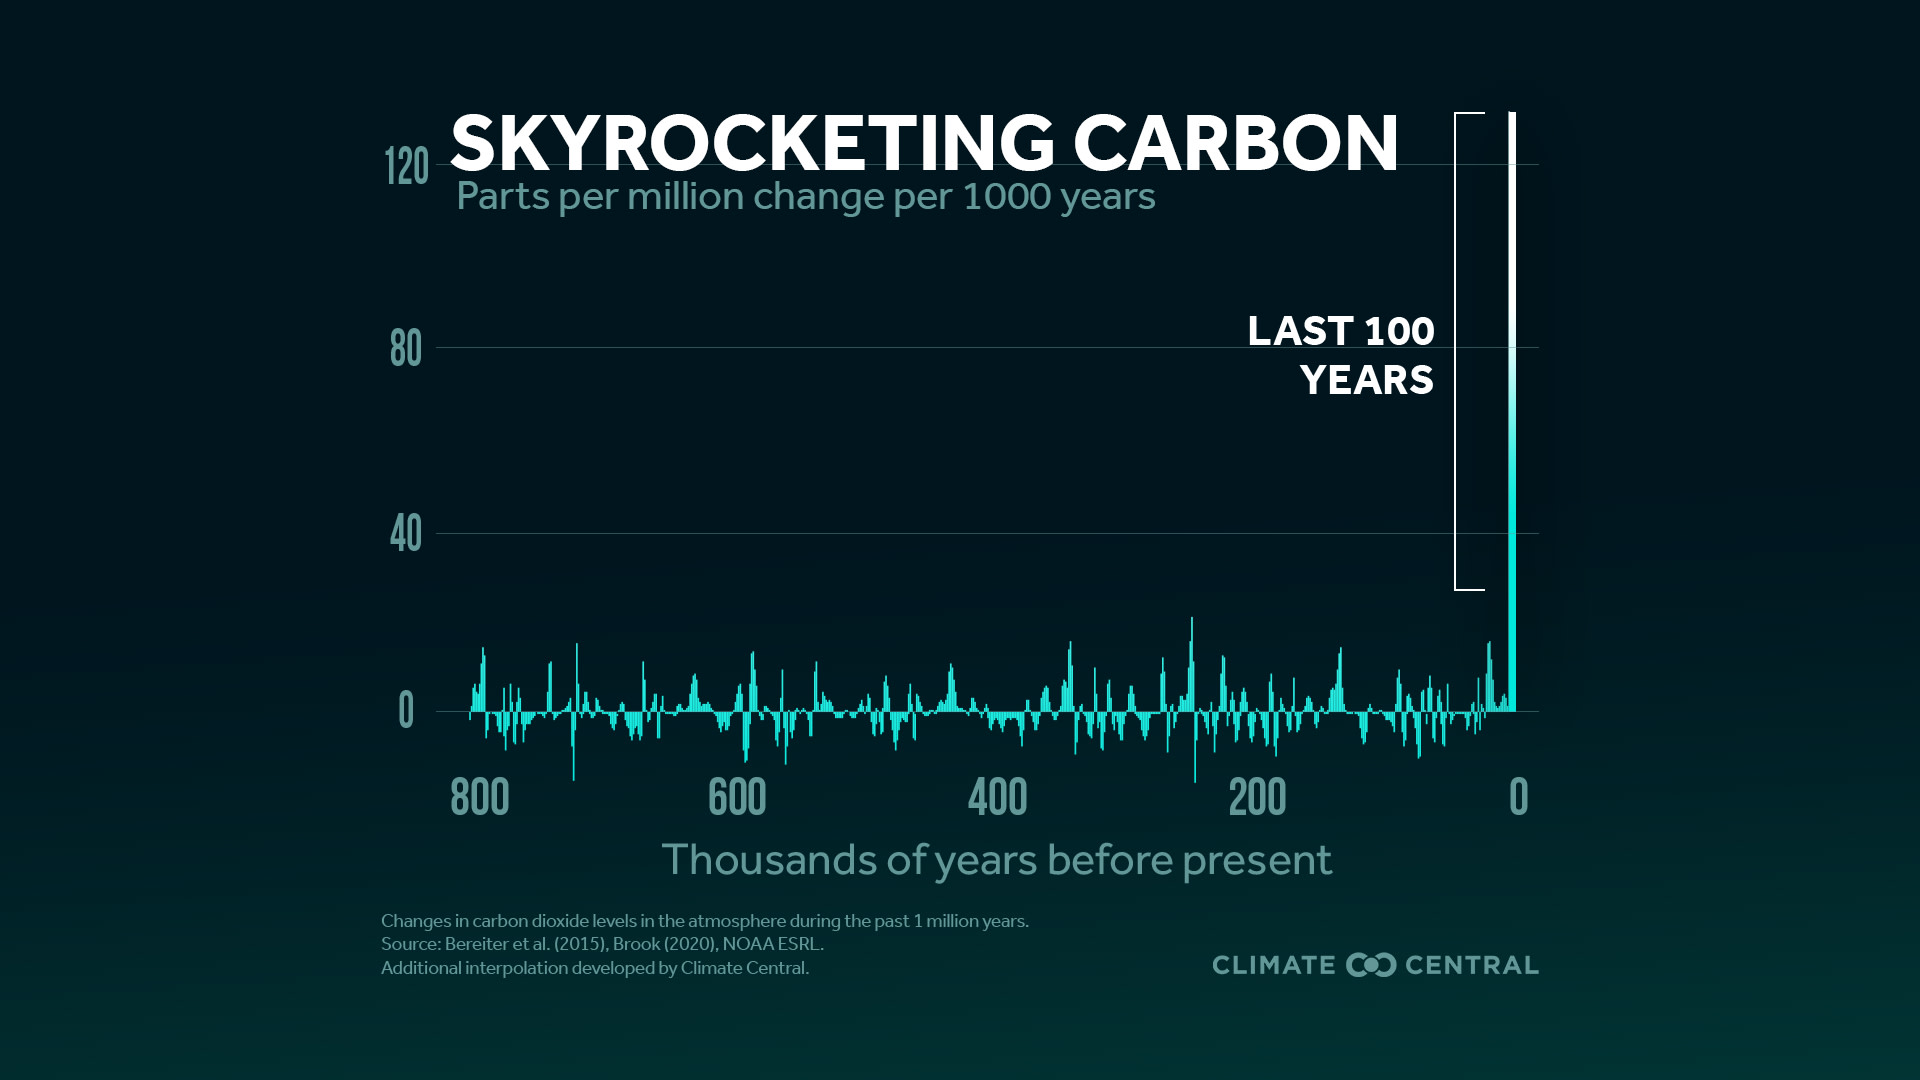
It’s not just the record CO2 levels, but also the record pace. The Carbon Skyscraper graph focuses on CO2 change rates over the last 800,000 years, capturing the incredible speed and amount of CO2 that humans are pumping into the atmosphere.
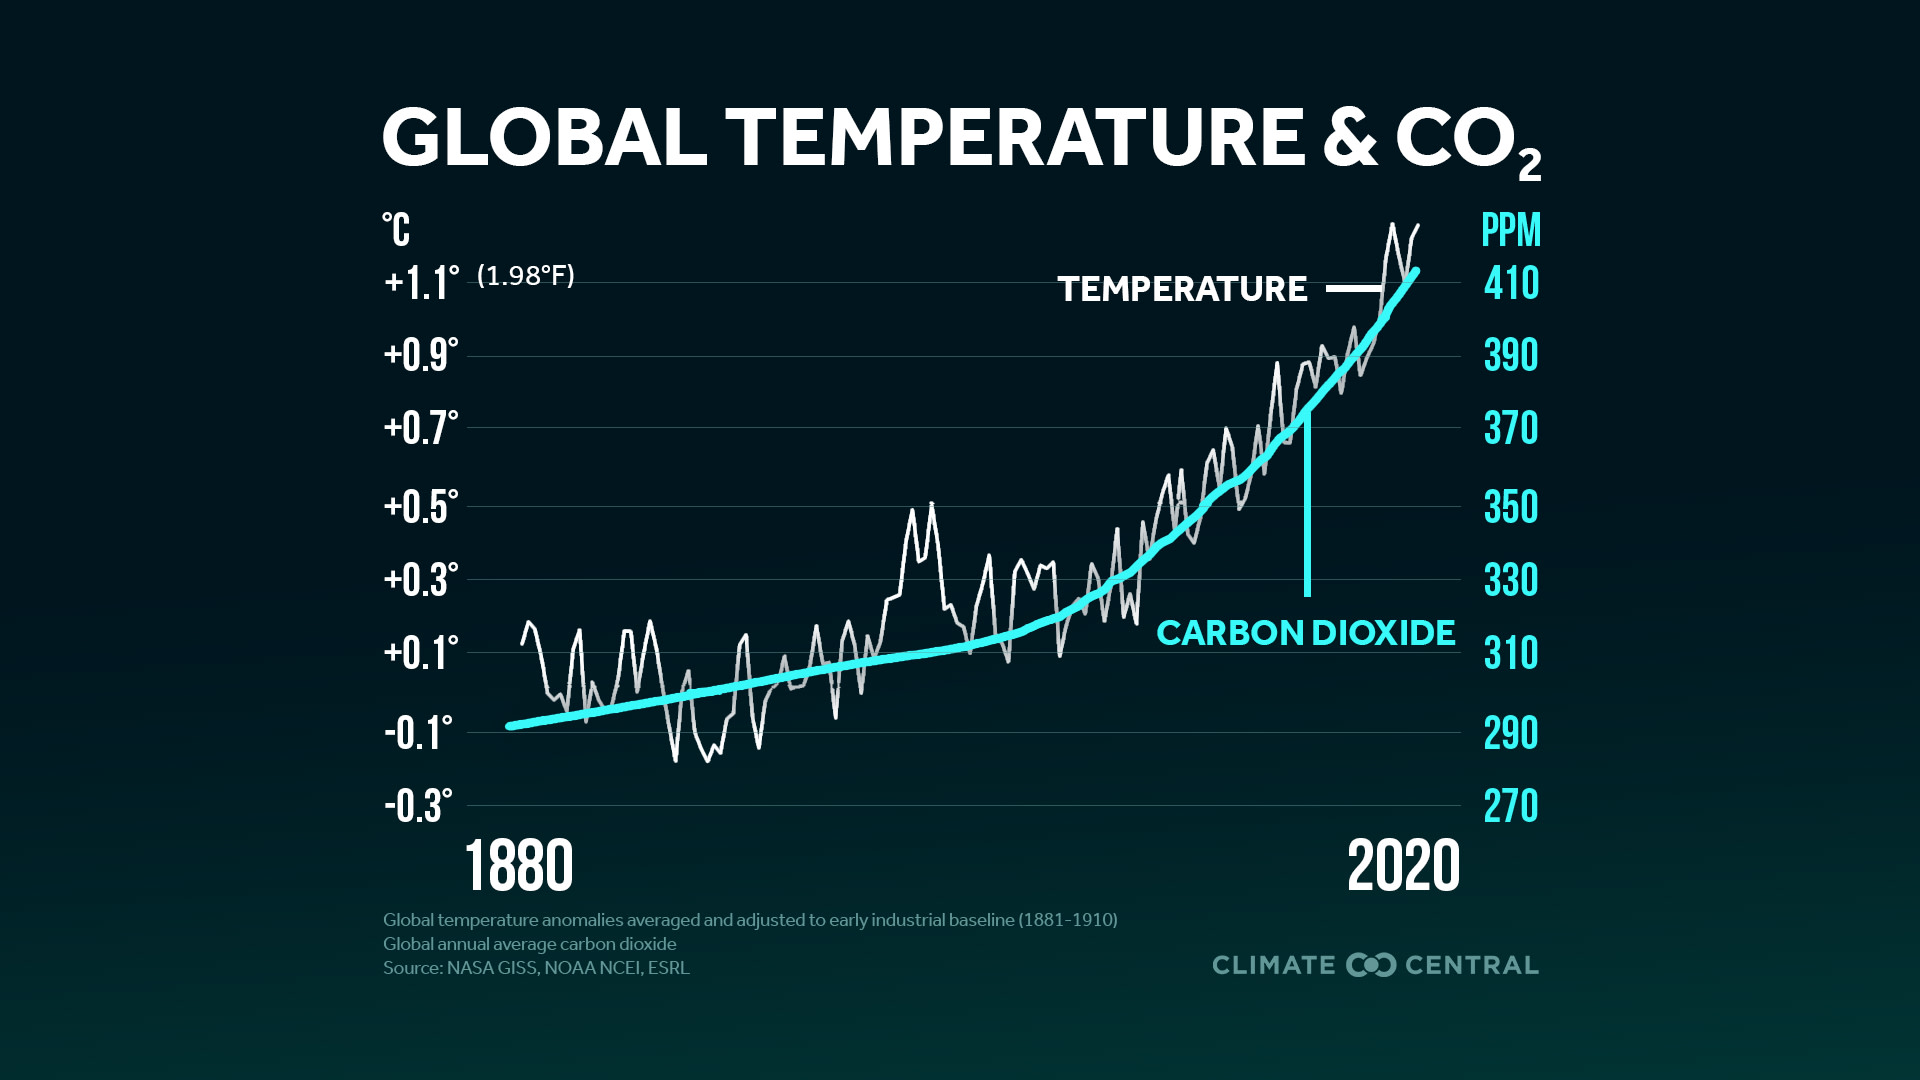
Carbon dioxide (CO2) and temperature go hand in hand. Thanks in part to paleoclimatology research, scientists know that atmospheric CO2 levels regulate global temperatures. A quick peek at the Earth's history shows us that when CO2 levels are high, global temperatures are high, and vice versa. Human-induced climate change follows this same principle: as we pump carbon emissions into the atmosphere, our planet warms.
Once it goes up, it takes a long time to come down. Although other greenhouse gases like methane have a stronger warming potential, CO2 is influential because it stays in the atmosphere much longer (generally between 300 and 1,000 years). In other words, the day we stop polluting, our warming troubles won't end—but at least they should stop getting worse. The more CO2 that accumulates in the atmosphere, the more warming we will see in the long-term.
Where we are now: CO2 levels are climbing and our global temperatures are following suit.
According to data from NOAA, daily peak CO2 reached just over 421 ppm (parts per million), up from 417 ppm last year at Mauna Loa.
The last time CO2 levels were around this range was more than 3.6 million years ago, when the temperature was about 7°F hotter and the sea level was about 78 feet higher than today.
Global additions of CO2 to the atmosphere dropped about 7% in early 2020, but as restrictions and lockdowns ended, emissions returned to their normal climb.
The global average temperature is nearly 1.2°C (2.1°F) above the preindustrial baseline—edging ever closer to the 1.5°C Paris Agreement goal.
The Carbon Skyscraper: It’s all about the rate. The rate of CO2 humans have emitted since the Industrial Revolution has no known rival in Earth’s history, yet the iconic 800,000 year CO2 graph understates our impact. Climate Central’s CEO, Benjamin Strauss, and Senior Computational Scientist, Scott Kulp, have a solution to fix that—the Carbon Skyscraper:
By focusing on the change in CO2 per period of time, instead of on the level, you can see the jaw-dropping rate at which humans have emitted CO2 in the last 100 years.
The Carbon Skyscraper is constructed by taking readings from the CO2 curve every 1,000 years going back from the present. See methodology for more.
Speed foretells danger. The faster the climate changes, the less the ability of society and ecosystems to adapt. Yet, the speed and scale of human innovation and production can also create solutions, and today, we have the potential to move quickly to reduce emissions.
POTENTIAL LOCAL STORY ANGLES
How are other greenhouse gases trending? What are the sources of greenhouse gases and carbon emissions?
Check out the Global Monitoring Laboratory to observe trends of greenhouse gases like carbon dioxide, methane, and nitrous oxide. To explore the different sources of greenhouse gases and carbon emissions, take a look at the EPA website. You can also use their interactive tool, Greenhouse Gas Inventory Data Explorer, to explore each sector and greenhouse gas. The US Energy Information Administration also has a breakdown of carbon emissions by state.
What are some solutions to curb carbon dioxide levels?
Check out Solutions Journalism to read what your peers are reporting about carbon dioxide and carbon capture solutions. A search in their Solutions Story Tracker database displays stories like a startup company investing in direct air capture technologies and scientists researching the potential of genetically modified carbon-hungry trees.
LOCAL EXPERTS
The SciLine service, 500 Women Scientists or the press offices of local universities may be able to connect you with local scientists who have expertise on carbon emissions in your area. In addition, the American Association of State Climatologists is a professional scientific organization composed of all 50 state climatologists.
NATIONAL EXPERTS
Benjamin Strauss, Ph.D.,
CEO and Chief Scientist, Climate Central
Discussion topics: The Carbon Skyscraper
Media Contact: Peter Girard, pgirard@climatecentral.orgRalph Keeling, Ph.D.,
Director, Scripps CO2 Program
Discussion topics: Keeling Curve, recent perturbations to the global carbon cycle
Contact: rkeeling@ucsd.eduValerie Trouet, Ph.D.,
Professor, Laboratory of Tree Ring Research, University of Arizona
Discussion topics: paleoclimatology, long-term CO2 trends
Contact: trouet@arizona.eduMatthew Lachniet, Ph.D.,
Professor, Department of Geoscience, University of Nevada
Discussion topics: paleoclimatology, long-term CO2 trends
Contact: Matthew.Lachniet@unlv.edu (available for both Spanish and English interviews)
METHODOLOGY
Carbon Skyscraper:
For raw data on past CO2 concentrations, we used the Antarctic Ice Cores Revised 800KYr CO2 Data (Bereiter et al. 2015) from the World Data Center for Paleoclimatology, Boulder and the NOAA Paleoclimatology Program, accessed in May 2020. For the period from 8,877 - 67,257 years before present (2020), we swapped in more recent data from the WAIS Divide Ice Core Marine Isotope Stage 3 CO2 record (Brook 2020) at the US Antarctic Program Data Center. Full calculations and methodology explained here.
Carbon Dioxide and Temperature Graph:
CO2 data is reported by NOAA’s Earth System Research Laboratory Global Monitoring Division. Calculations of average annual global temperature are performed independently at NASA and NOAA (among other groups). Climate Central combines these and compares temperatures to an earlier 1881-1910 baseline to assess warming closer to the preindustrial era.