Climate Matters•February 11, 2015
Valentine's & Presidents' Day 2015
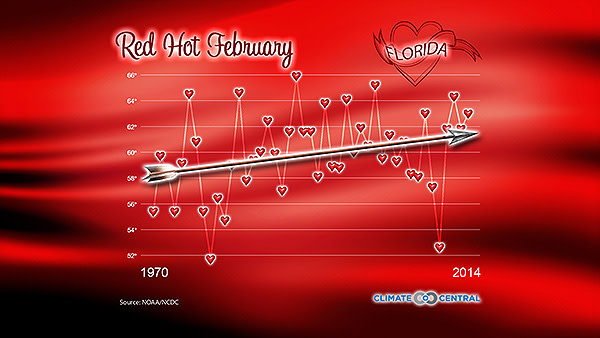

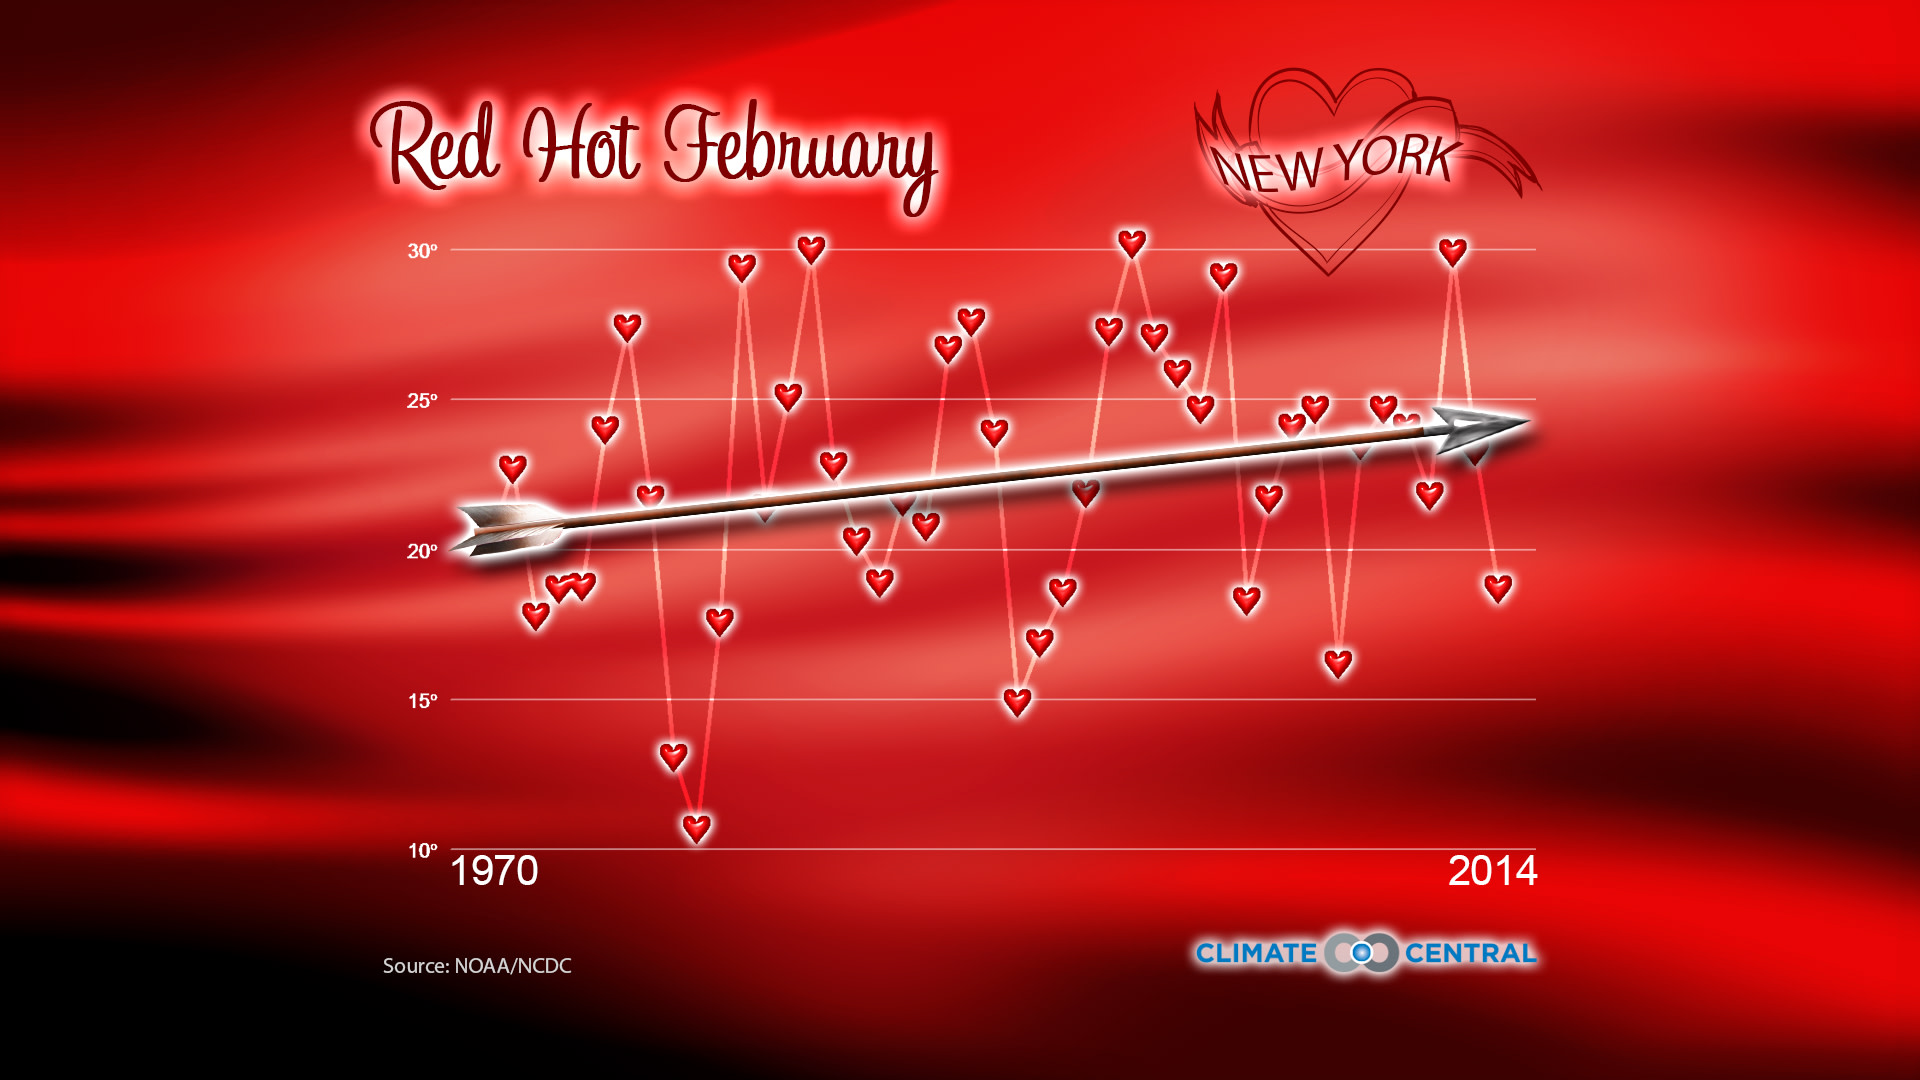
Love is in the air and you might be making plans for Valentine’s Day. As greenhouse gases trap heat in our atmosphere, it’s possible you’ve got one hot date ahead of you. We took a look at February's long-term warming trend since 1970 and found that’s not far from the truth.
Our state-specific analysis of average February temperatures since 1970 shows Februaries are getting warmer for the majority of states. Vermont is the fastest-warming state, with the average February temperature rising 4°F since 1970. Seven of the 10 fastest-warming states are in the Northeast, which also happens to be one of the fastest-warming regionsof the country in winter.
There are eight states with a slight downward trend in February average temperatures. All eight are located in the western half of the U.S., with Wyoming showing the greatest dip. However, the decline is only 0.8°F — much smaller than the fastest-warming states — and despite a February cooling trend, winters are still warming in Wyoming.
Additionally, every season has been warming since 1970 nationally and that rate of warming has accelerated compared to the past. That’s consistent with what we expect as more greenhouse gases are pumped into the atmosphere.
Valentine’s Day isn’t the only holiday we’re celebrating: it’s also Presidents' Day. (Historical note: until 1971, it commemorated George Washington’s birthday only).
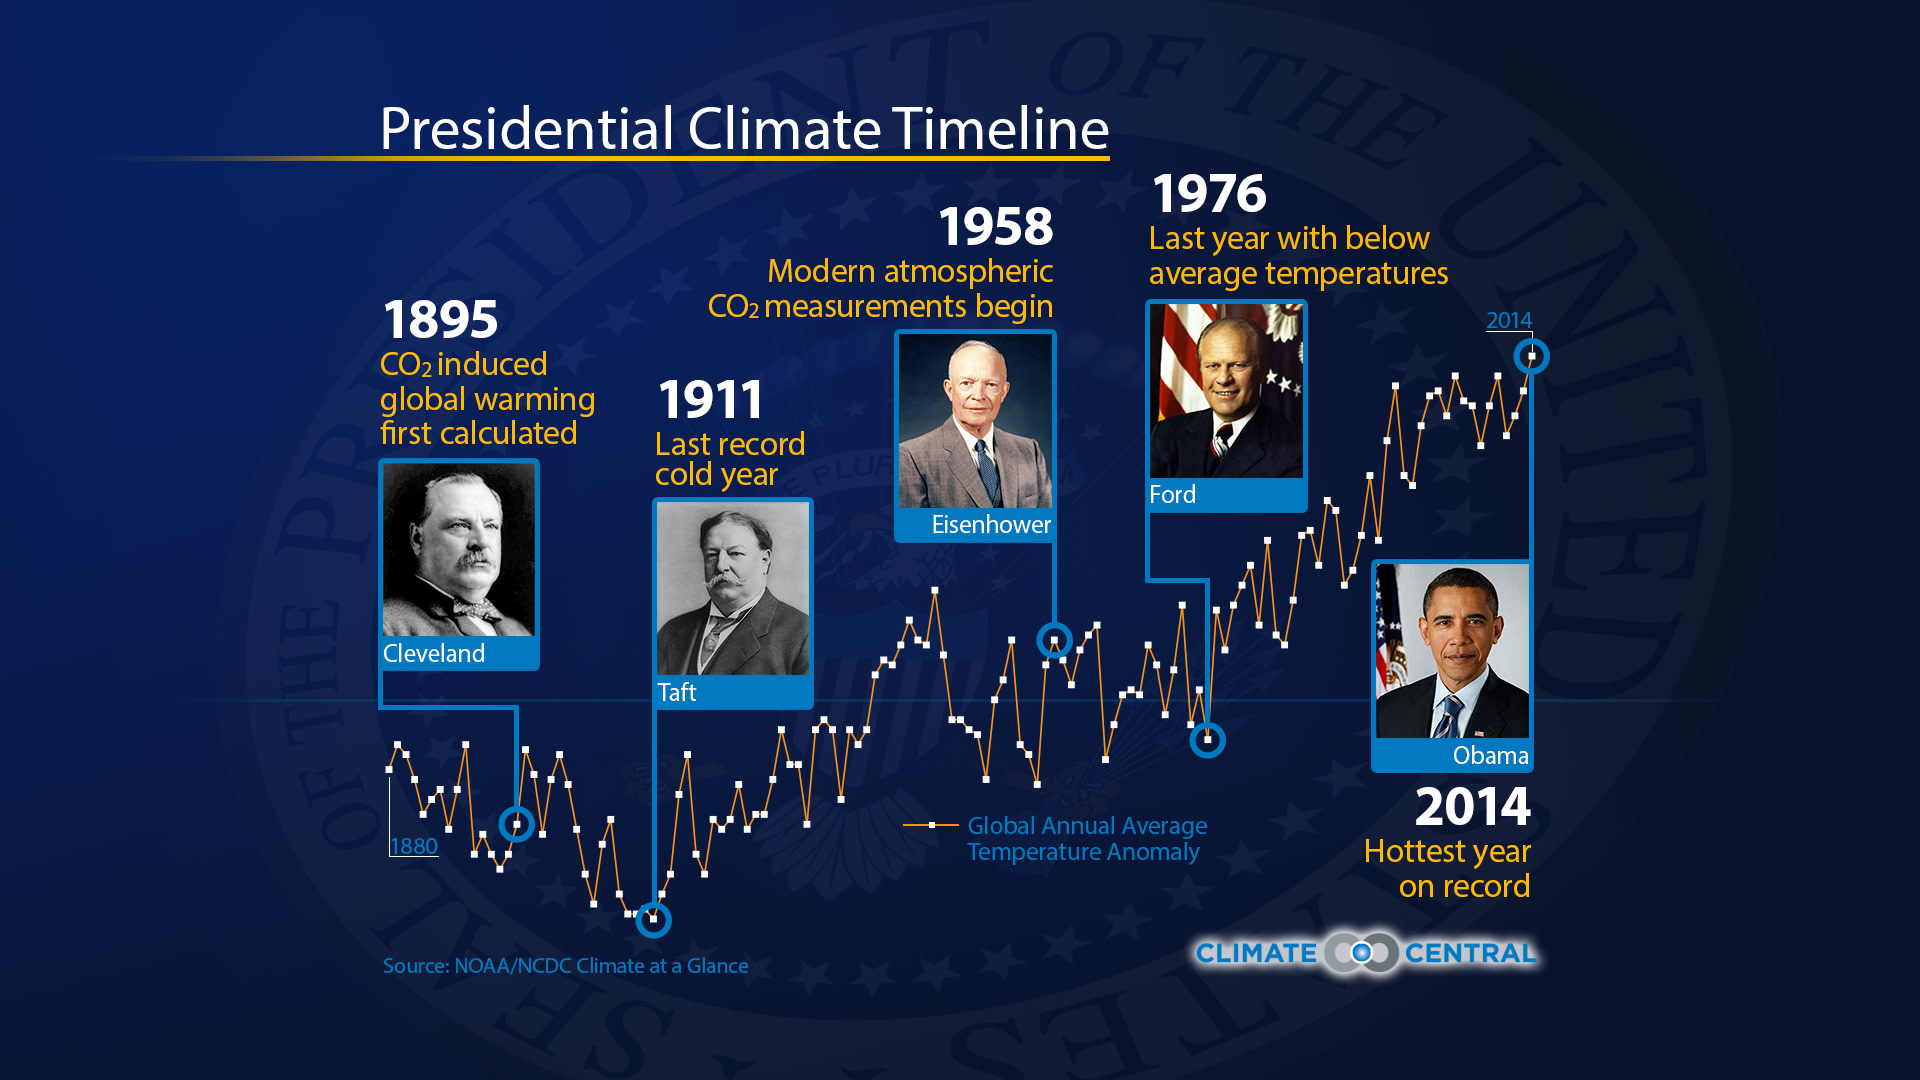
In honor of all the presidents, we thought it would be useful to look at major climate and weather milestones of the past, both natural and manmade, by presidential term. We’re presenting the information in two forms: a graphic, which highlights milestones since modern temperature records began in 1870, and an interactive timeline that goes all the way back to George Washington, since climate, weather and energy milestones were happening well before modern recordkeeping began.
Here are a few highlights:
1777 — The Little Ice Age, a natural climate cycle that dropped temperatures well below average for several centuries, makes George Washington’s winter camp at Valley Forge so brutally cold that the episode is still part of American Revolutionary lore. The Industrial Revolution, which started the buildup of heat-trapping CO2 in the atmosphere, was just getting under way at about this time.
1859 — John Tyndall discovers that CO2 is a heat-trapping gas during the administration of James Buchanan.
1895 — Svante Arrhenius publishes the first calculation showing how CO2 from fossil-fuel burning is warming the planet, while Grover Cleveland leads the nation.
1911 — The last time during the era of modern recordkeeping that the planet experienced record global cold. William Howard Taft is in office.
1958 — Charles Keeling begins recording atmospheric levels of CO2 from an observatory on Manua Loa, in Hawaii — a project that has continued uninterrupted ever since. Dwight Eisenhower is halfway through his second term.
1965 — Lyndon Johnson is the first president to warn of the dangers of carbon dioxide pollution from burning fossil fuels.
1970 — The Clean Air Act is signed into law by Richard Nixon. By reducing particulate emissions that had been shielding the planet from solar energy, this inadvertently allows global warming to speed up.
2012-14 — As the planet continues to warm under its blanket of greenhouse gases, climate milestones have been coming along more often. The lowest Arctic sea ice extent on record (2012), the cracking of the 400 parts per million level for CO2 in the atmosphere (2013), and the hottest year on record(2014) have all come during the administration of Barack Obama.