Climate Matters•September 12, 2018
Tropical Cyclone Records & Rainfall Extremes


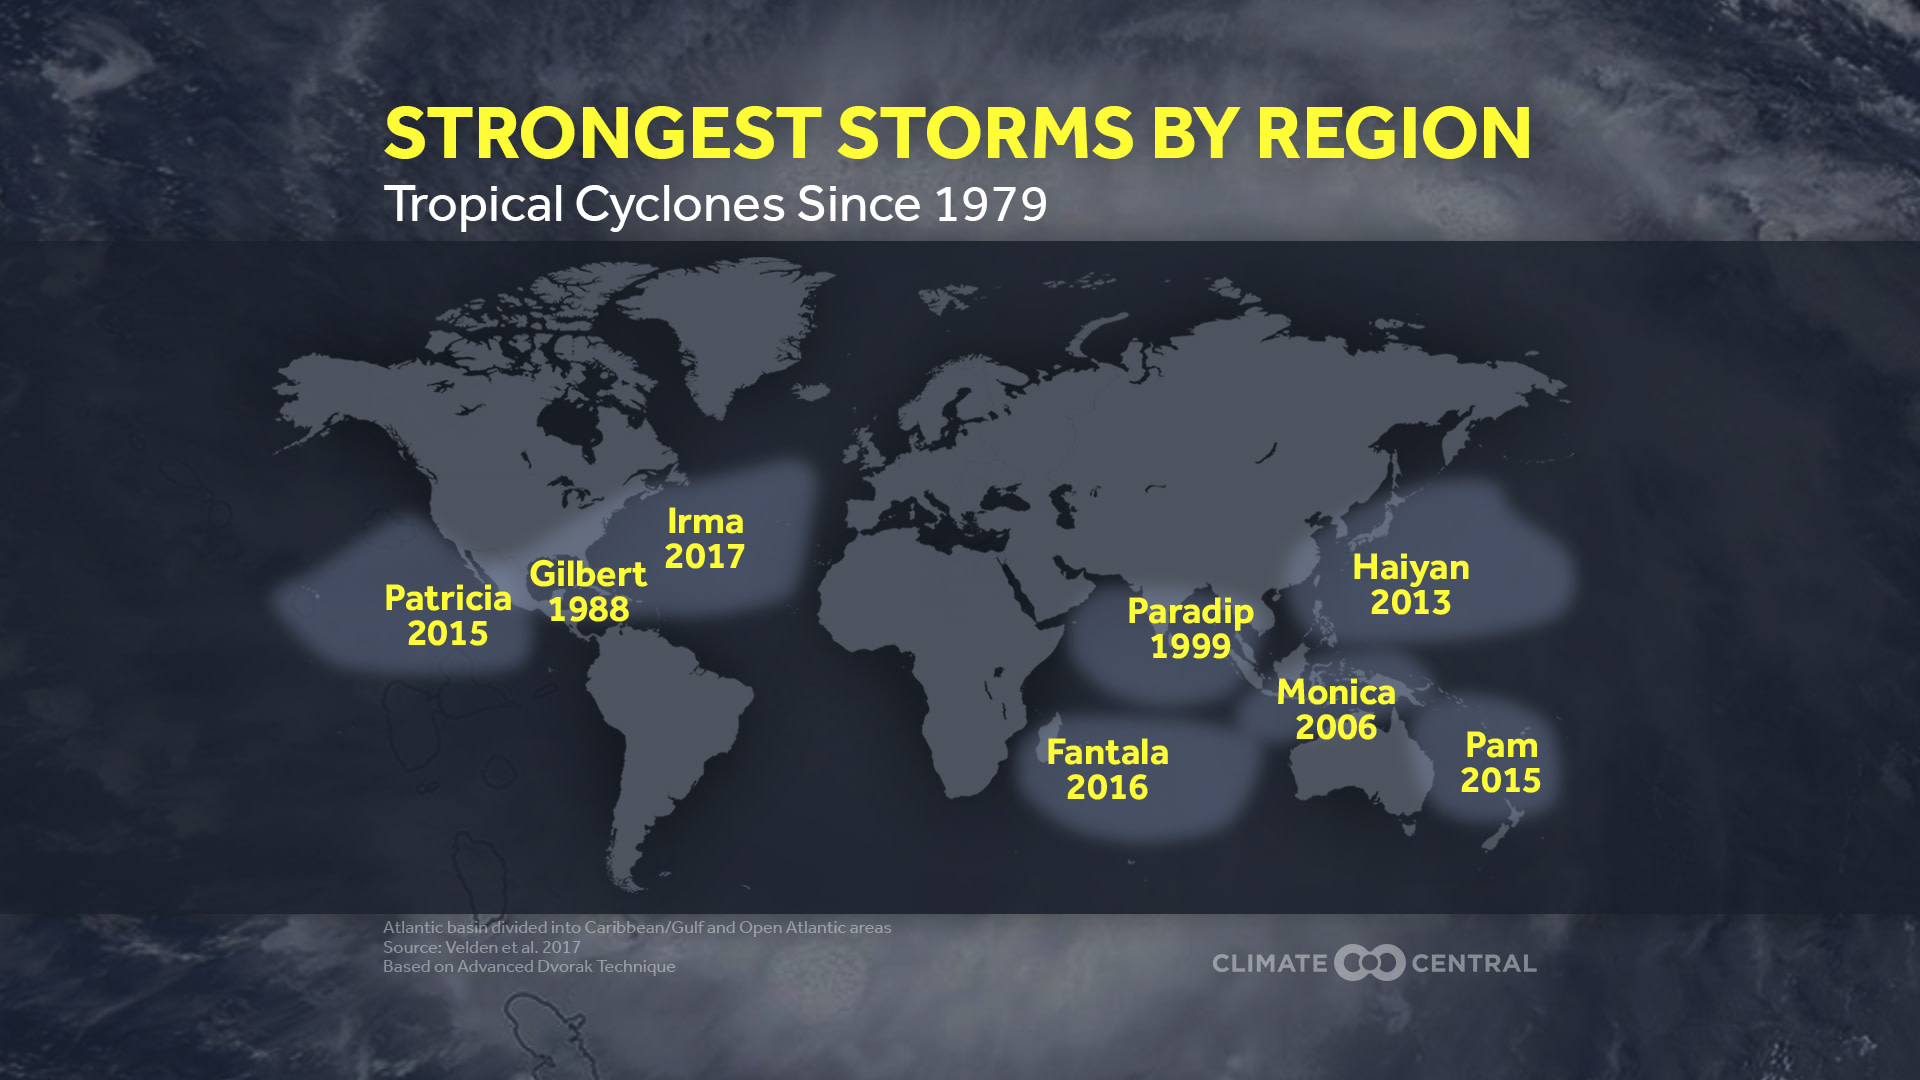
Tropical cyclones, the more general term for hurricanes globally, have been setting records in the last few years. In a warming climate, the most intense of these storms are getting stronger, and some of the strongest on record have been seen in the last decade.
Defined by wind speed, last year’s Hurricane Irma was the strongest storm on record in the Atlantic basin outside of the Caribbean Sea and the Gulf of Mexico, and just three years ago, Hurricane Patricia became the eastern Pacific’s strongest storm on record with a maximum sustained wind of 215 mph. To compare these storms with others across the world that could not be measured by instruments from aircraft reconnaissance, a satellite classification called the Advanced Dvorak Technique is used (methodology below). That classification indicates that tropical cyclone intensity records have been set in the northwest Pacific (Haiyan 2013), the southwest Pacific (Pam 2015), and southern Indian basins (Fantala 2016) in the last decade.
In the Atlantic basin, where data from reconnaissance aircraft is common, the seven strongest hurricanes ranked by measured wind speed and central pressure are listed below:
By wind speedBy central pressure


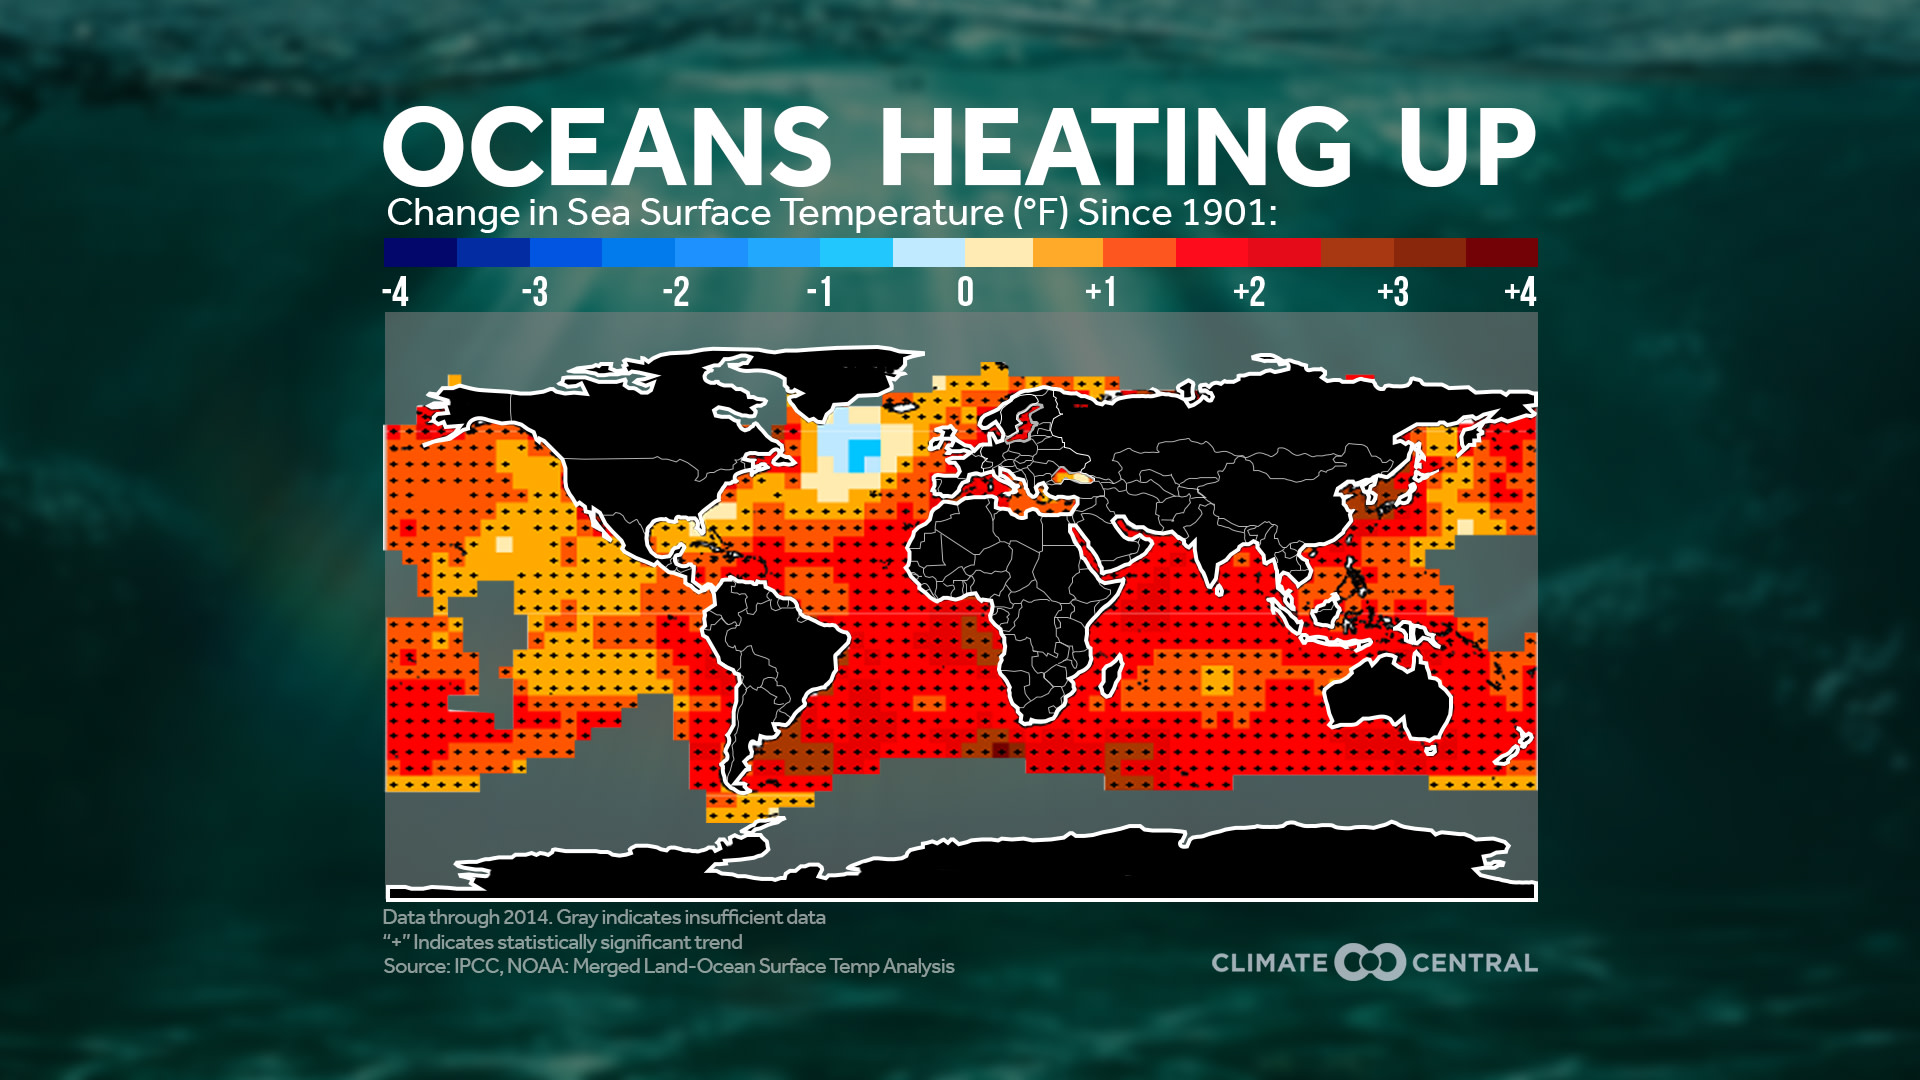
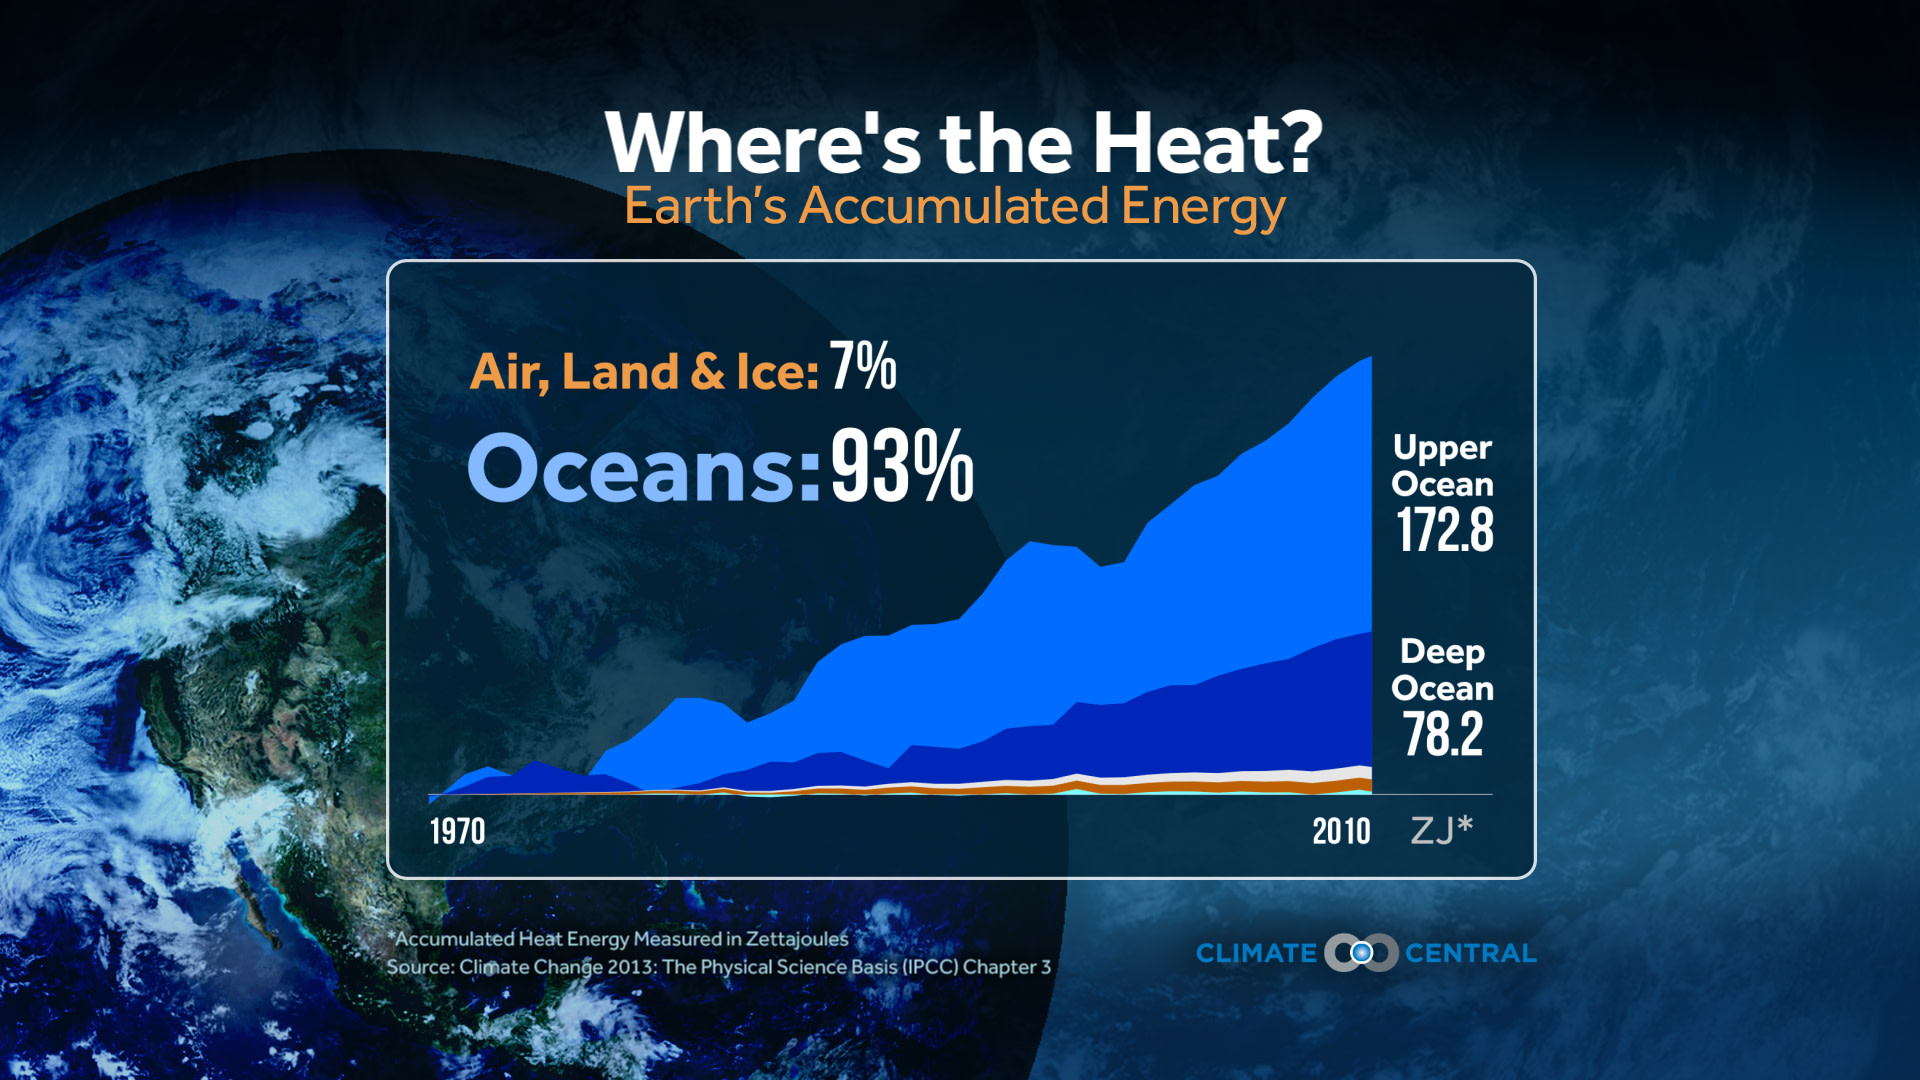
While there are multiple conditions necessary for hurricanes to form, the energy that sustains these storms comes from the warm ocean water. More than 90 percent of the warming from human-induced climate change has gone into the global oceans, raising water temperatures 2°-4°F over the past century. That has translated to warming in the tropical Atlantic and along the U.S. coasts.
As warming of the climate system continues, an increase in the number of tropical cyclones each year is not necessarily expected, but their impacts will be magnified. Studies have shown that climate change enhanced the rain totals from Hurricane Harvey last year, and rising seas drove the storm surge from Sandy farther inland in 2012. With sea levels projected to rise at least a few more feet by the end of the century, storm surge will push even farther inland, affecting more people and doing more damage.
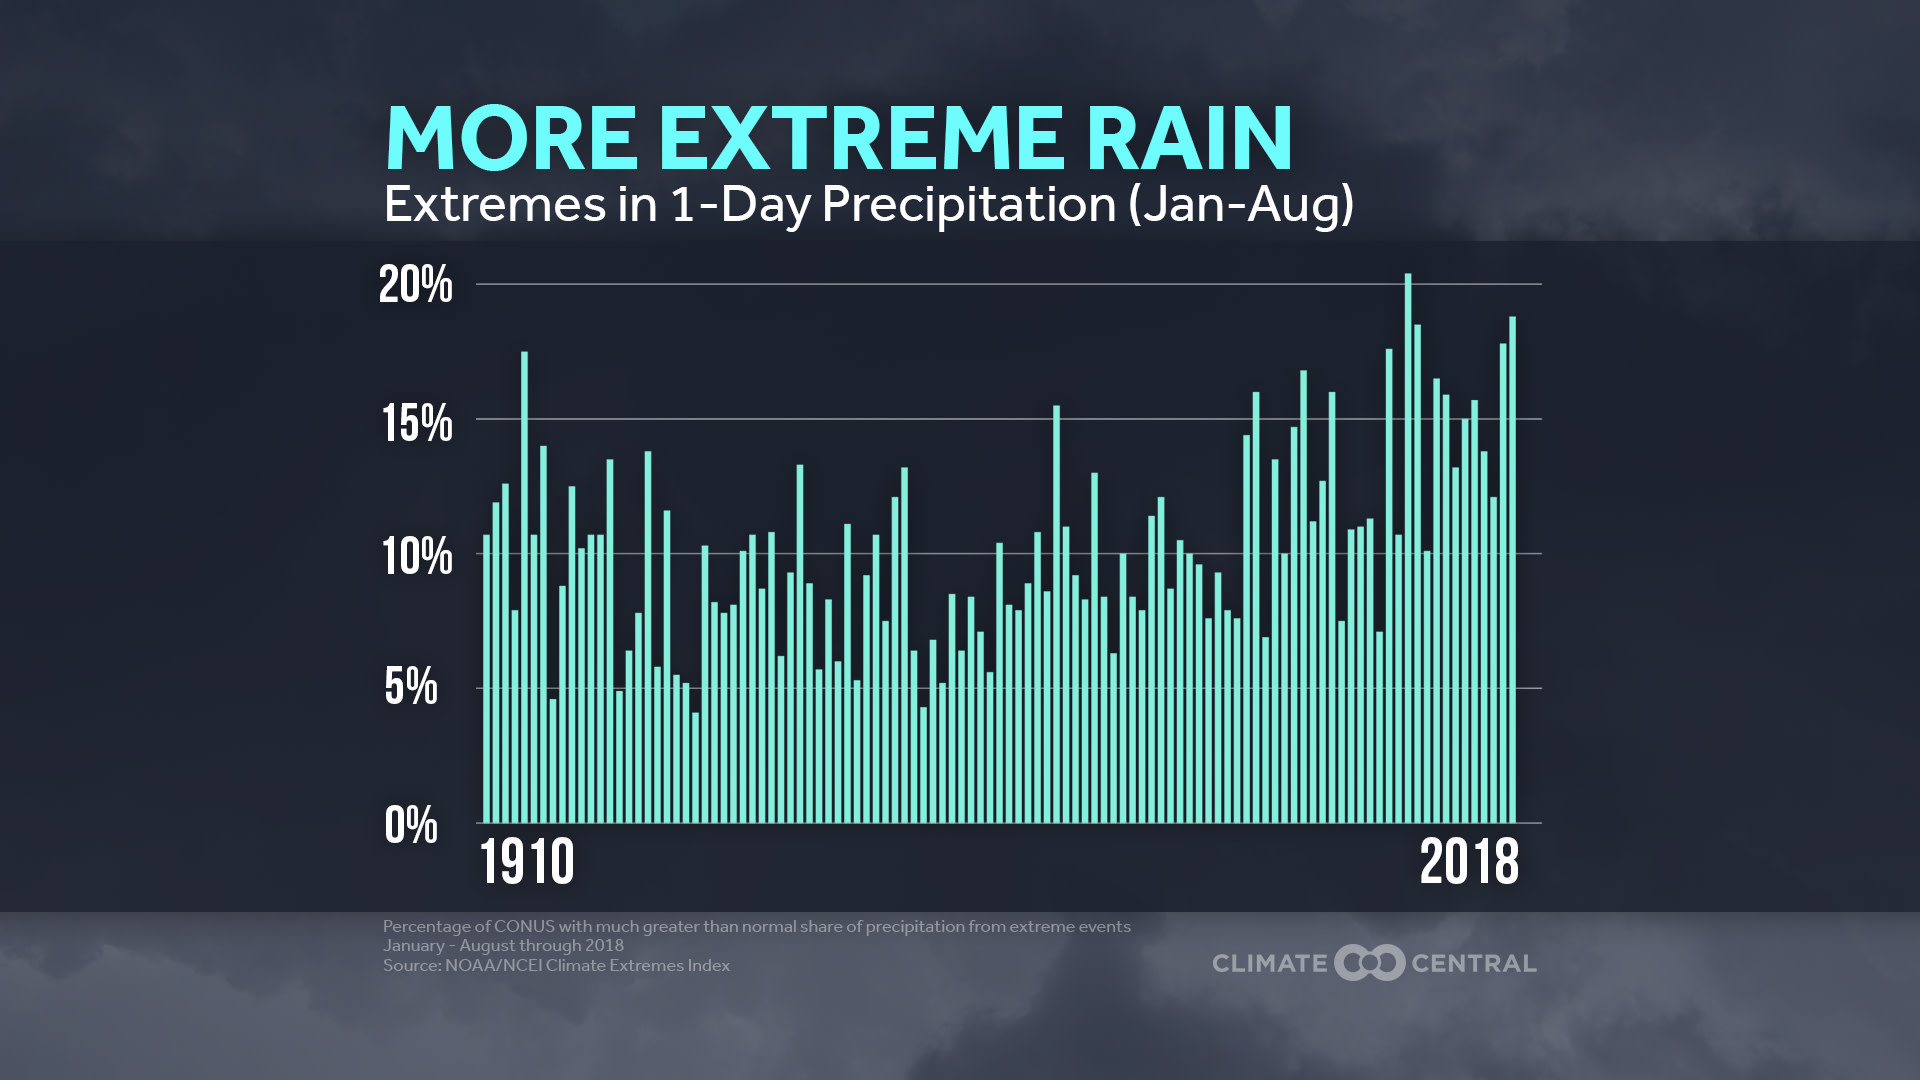
This summer has brought flooding rainfall to several parts of the U.S. Pennsylvania had its wettest summer on record, and the neighboring states of Maryland, Virginia, and West Virginia each had one of their 10 wettest summers on record. The warming climate enhances the water cycle, leading to more extreme rainfall. The NCEI Climate Extremes Index indicates a surge in the amount of precipitation in the U.S. from the heaviest 1-day events over the past 20 years.
Methodology: The globally strongest tropical cyclones are evaluated since the satellite era (1979) using the Advanced Dvorak Technique (ADT), based on Valden et al. (2017). This technique uses satellite data to determine strength remotely, and more information on the ADT can be found here. The top seven Atlantic basin storms are based on the highest 1-minute wind speed and the minimum central pressure observed during the lifetime of the storm. The Climate Extremes Index has been developed and calculated by NCEI.