Climate Matters•October 30, 2018
Halloween Extremes & Trends
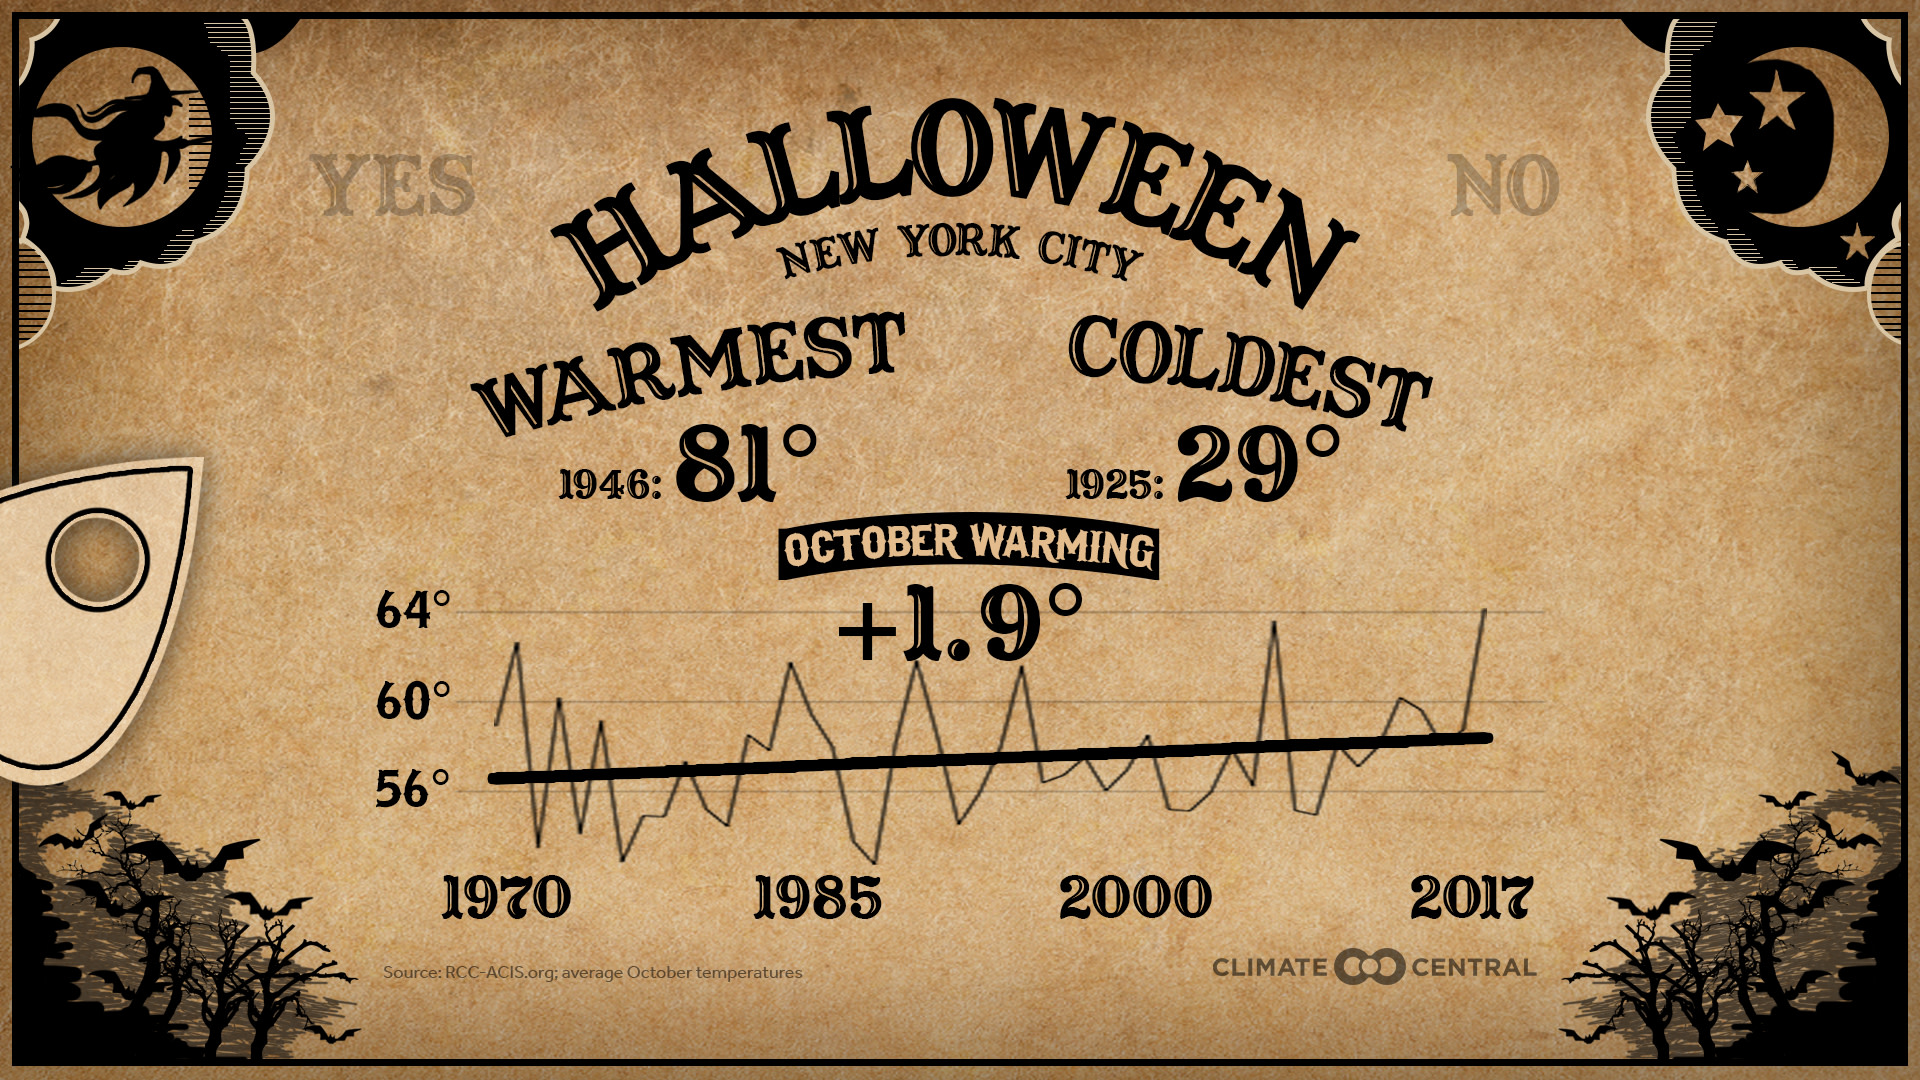
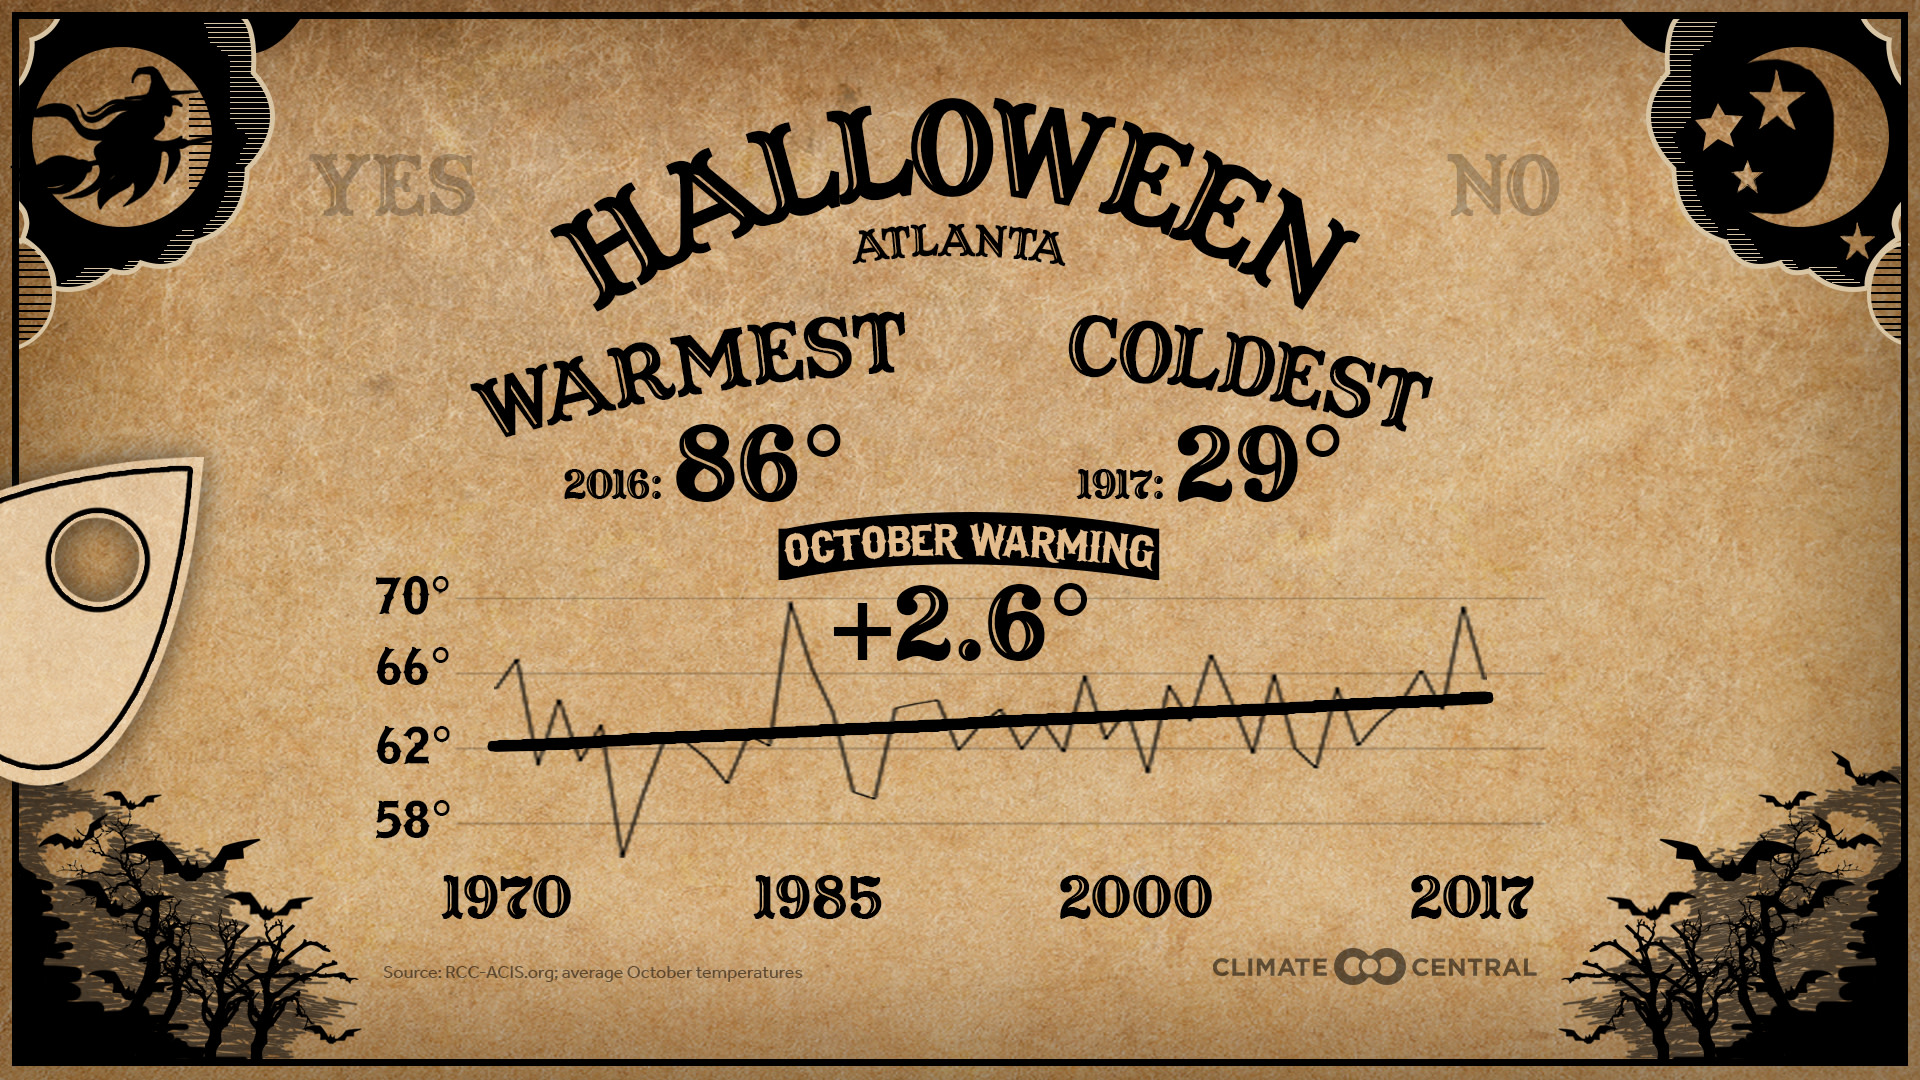
Halloween weather can vary dramatically from year-to-year, but it’s important to consider how the long-term trends may affect trick-or-treating. This week, we cover both angles, examining Halloween extremes and October average temperatures across the U.S.
October is known for its drastic temperature swings. This year, October began with a warm spell in the eastern U.S. and a cold spell in the West, only to show the opposite pattern two weeks later. On Halloween, the record high and record low temperatures for an individual city differ by an average of 60 degrees, and as much as 87°F in Abilene, Texas. National records range from 101°F in Palm Springs to -27°F in Fairbanks. With this variability, planning the right costume has always been a challenge.
But because of climate change, Octobers are warming in much of the country. Of the 244 cities analyzed, 82 percent have warmed at least 1°F in the last half-century, while only 2 percent have cooled 1°F or more. The Southwest is warming the most, with trends above 5°F in El Paso, Tucson, Las Vegas, Phoenix, and Las Cruces. These trends match our recent analyses on average fall temperatures, as well as average fall minimums. The warming can lengthen the allergy season, harm peak foliage, and allow disease-carrying insects to remain active.
Climate change has scary consequences for trick-or-treaters, too. Supplies of chocolate, the backbone of Halloween, are at risk from rising temperatures and changing rainfall patterns. Areas of West Africa, which support a majority of the world’s cacao trees, could lose up to 40 percent of their suitable land by 2050. Pumpkin harvests can also suffer from heavy rain, which is getting heavier as the climate warms. In 2015, record rains in Illinois (which produces over 90 percent of the country’s processed pumpkins) reduced pumpkin yields by over 50 percent. Even the nation’s costume industry, which generates over $2 billion each year, could be affected. With warmer evenings, trick-or-treaters may be more reluctant to step into those toasty Darth Vader suits.
Methodology: Halloween temperature extremes and October temperature trends are calculated using data from the Applied Climate Information System. Extremes are given for each station’s entire period of record, while trends begin in 1970 for consistency between stations. Displayed trend lines are based on a mathematical linear regression.