Climate Matters•May 15, 2019
Downpour
KEY POINTS
Climate change strengthens downpours, heightening the risk of damaging floods
Most U.S. cities assessed by Climate Central have seen their rainiest days intensify since 1950
Details below — and read our related report, POURING IT ON
Human-caused climate change strengthens the heaviest downpours. More than 70 percent of the planet’s surface is water, and as the world warms, more water evaporates into the atmosphere. That additional moisture makes heavy rain heavier,increasing the risk of flooding. This year, extreme rainfall has devastated communities from California to Tennessee. In the Midwest, flooding has caused billions of dollars of damage. (While ice jams, snowmelt, and levee failures have worsened the flooding, heavy downpours haven’t helped.)
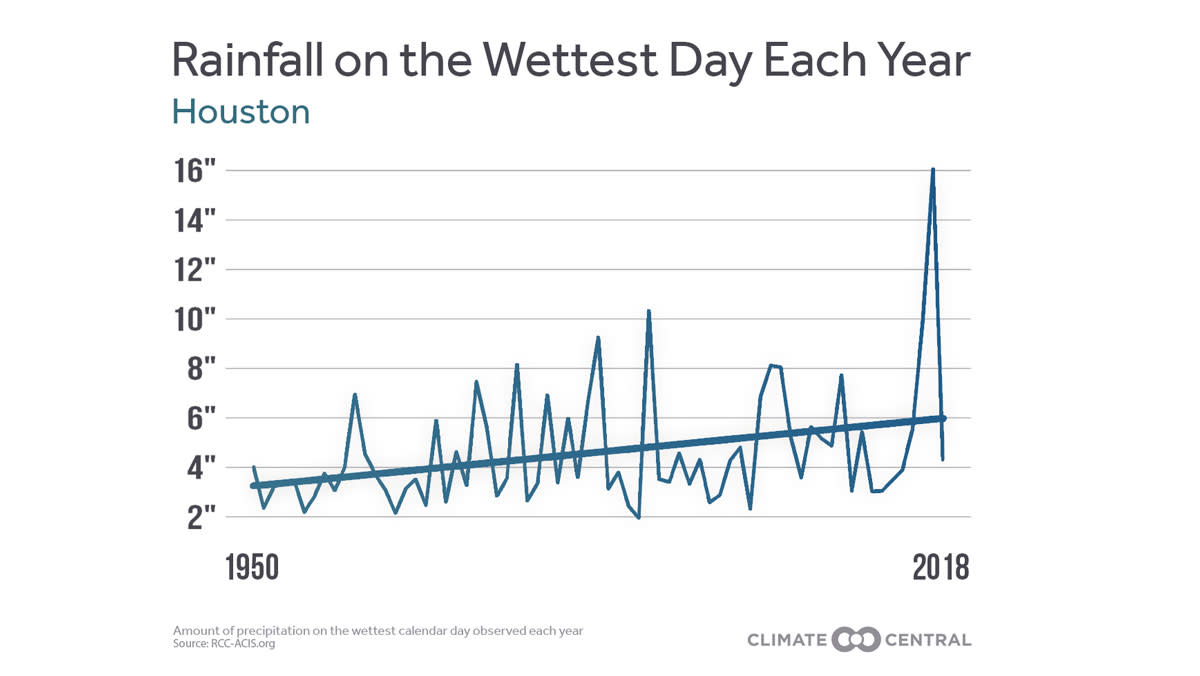
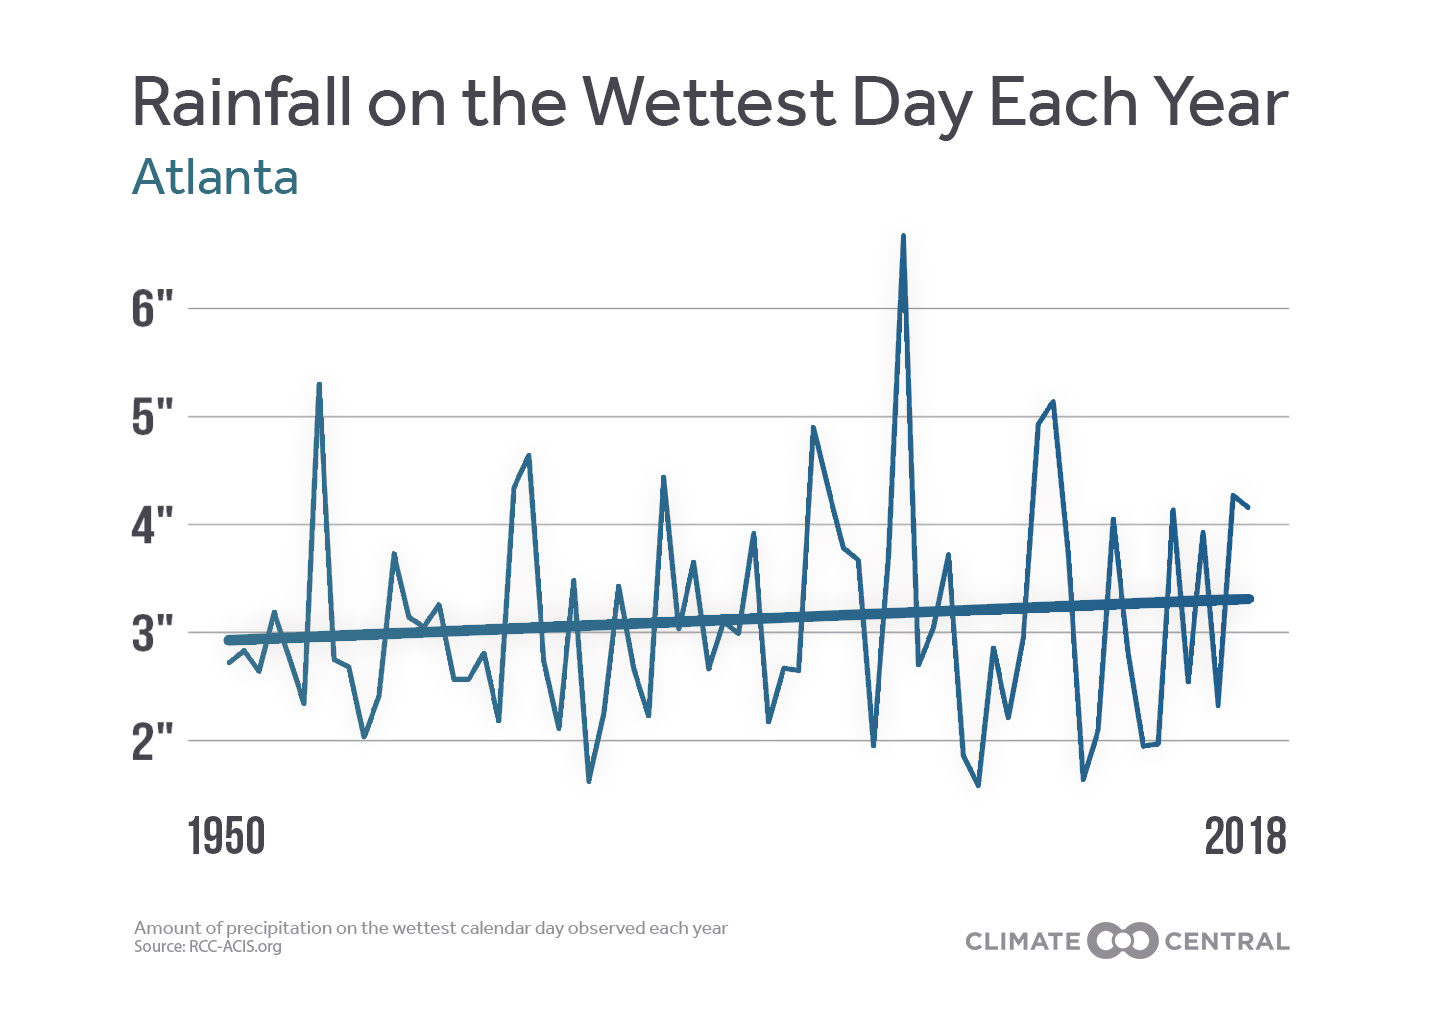
Floods are especially common on the rainiest day of the year — the single calendar day with the most measured precipitation. So Climate Central tracked how those wet days have changed over time in 244 U.S. cities.
79 percent saw their rainiest days get even wetter since 1950. And in 32 cities, the average precipitation on the year’s wettest day has increased by an inch or more. Houston, Texas tops the list with an increase of 2.78 inches — even without recent flash flooding. Though an extra inch of rain may not sound like much, consider that most rainy days fail to deliver an inch of precipitation in the first place.
One-inch storms are also happening more often: the national frequency of 1”, 2”, and 3” storms has markedly increased since 1950. As most individual cities observe similar trends, threats of flooding are spiking upward.

1"
TITLE: JPG

2"
TITLE: JPG

3"
TITLE: JPG
“Global warming has already made wet places wetter, and those changes are set to continue,” said Jennifer Brady, Climate Central’s senior data analyst. “For many American communities, extreme rainfall events bring serious costs.”
Those costs range from damaged crops to public health risks: among other things, heavy rain can cause sewage overflows and create conditions more conducive to disease-carrying mosquitoes.
Methodology: Using data from the Applied Climate Information System, Climate Central identified the calendar day each year with the highest precipitation for each station. Trendlines are based on a mathematical linear regression. Trends in one-, two-, and three-inch rainfall analyses are based on a methodology from Brian Brettschneider, a climate researcher at the University of Alaska Fairbanks. Climate Central's analysis includes 244 stations. However, for data summaries based on linear trends, only 242 stations were included due to large data gaps in St. Johnsbury, Vermont and Wheeling, West Virginia.
YOUR LOCAL DATA: To download data on extreme rainfall from all 244 weather stations analyzed, click here.