Climate Matters•February 24, 2020
2020 Spring Package


This year we’re introducing something new—updating our most popular seasonal trends and combining them into a neat package at the beginning of every season! With the start of meteorological spring on March 1st, this package includes:
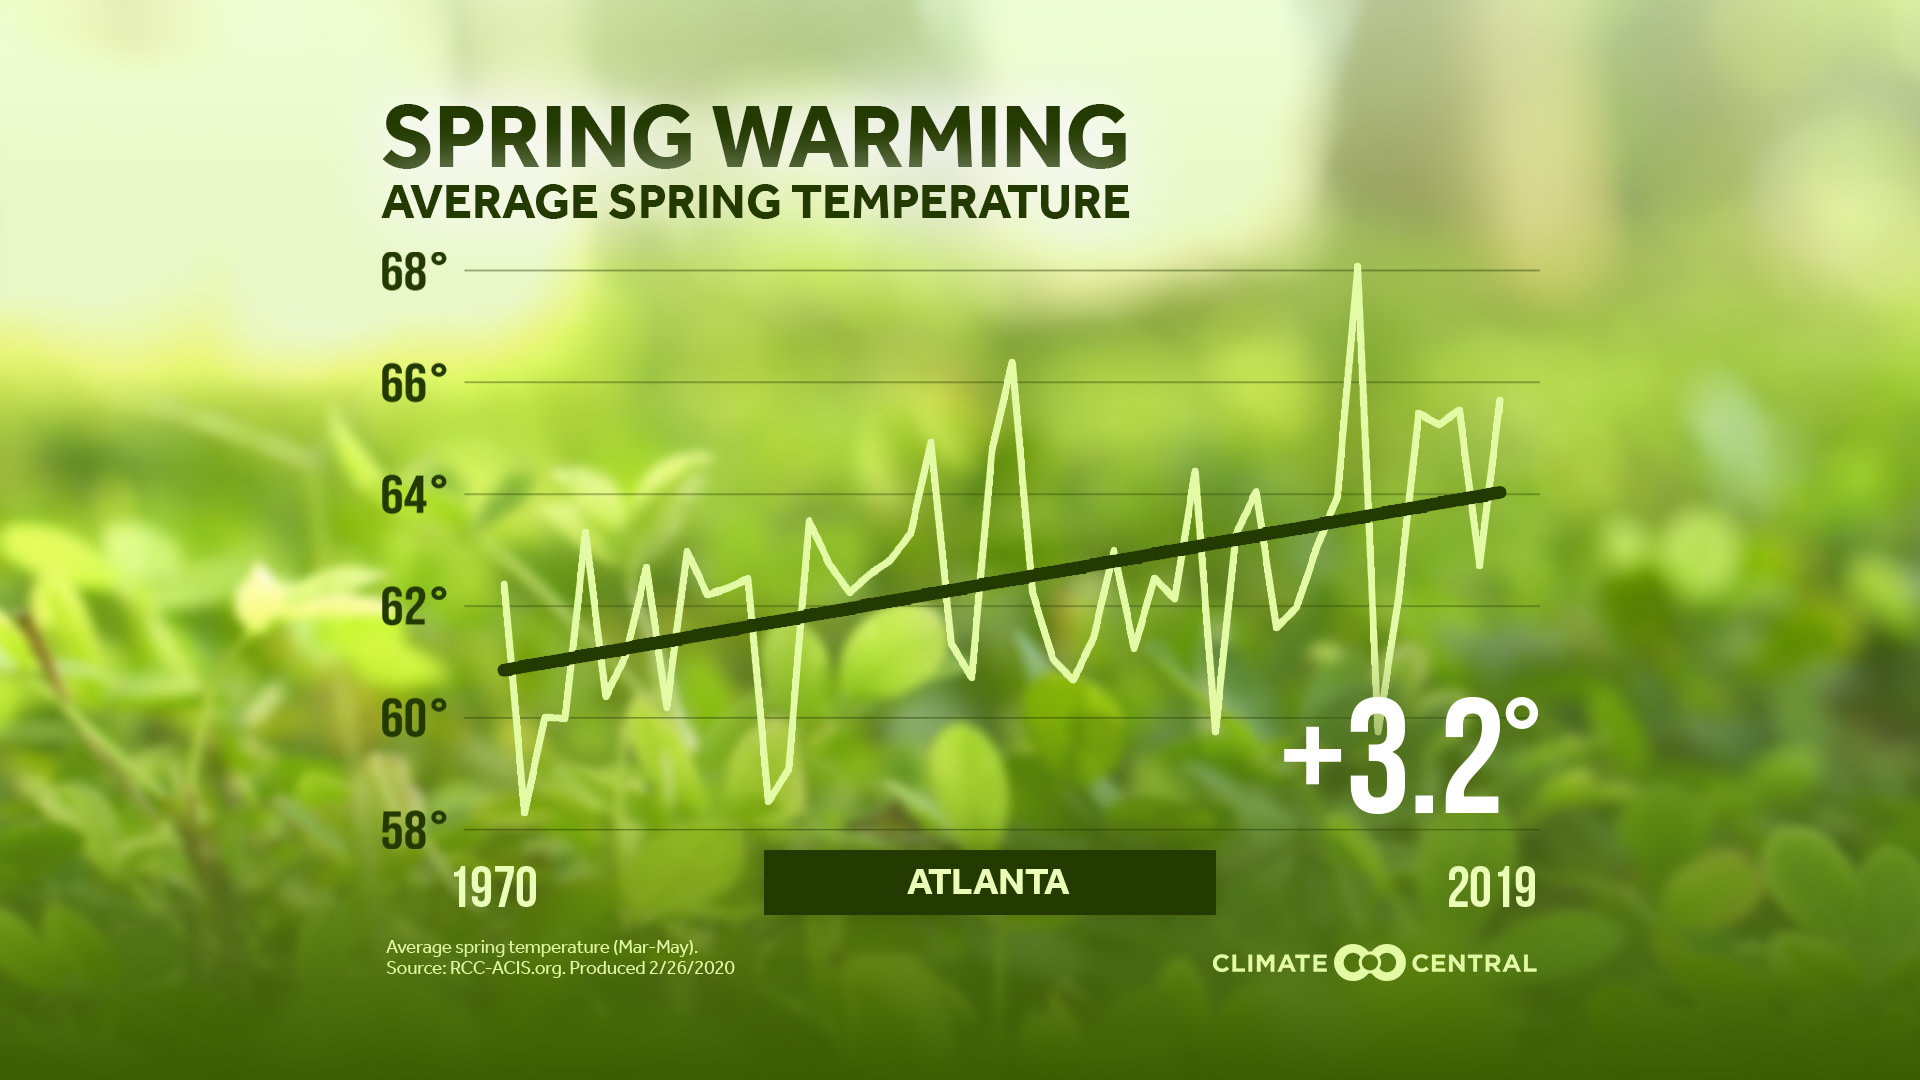
Average Spring Temperatures, local trends and a national map
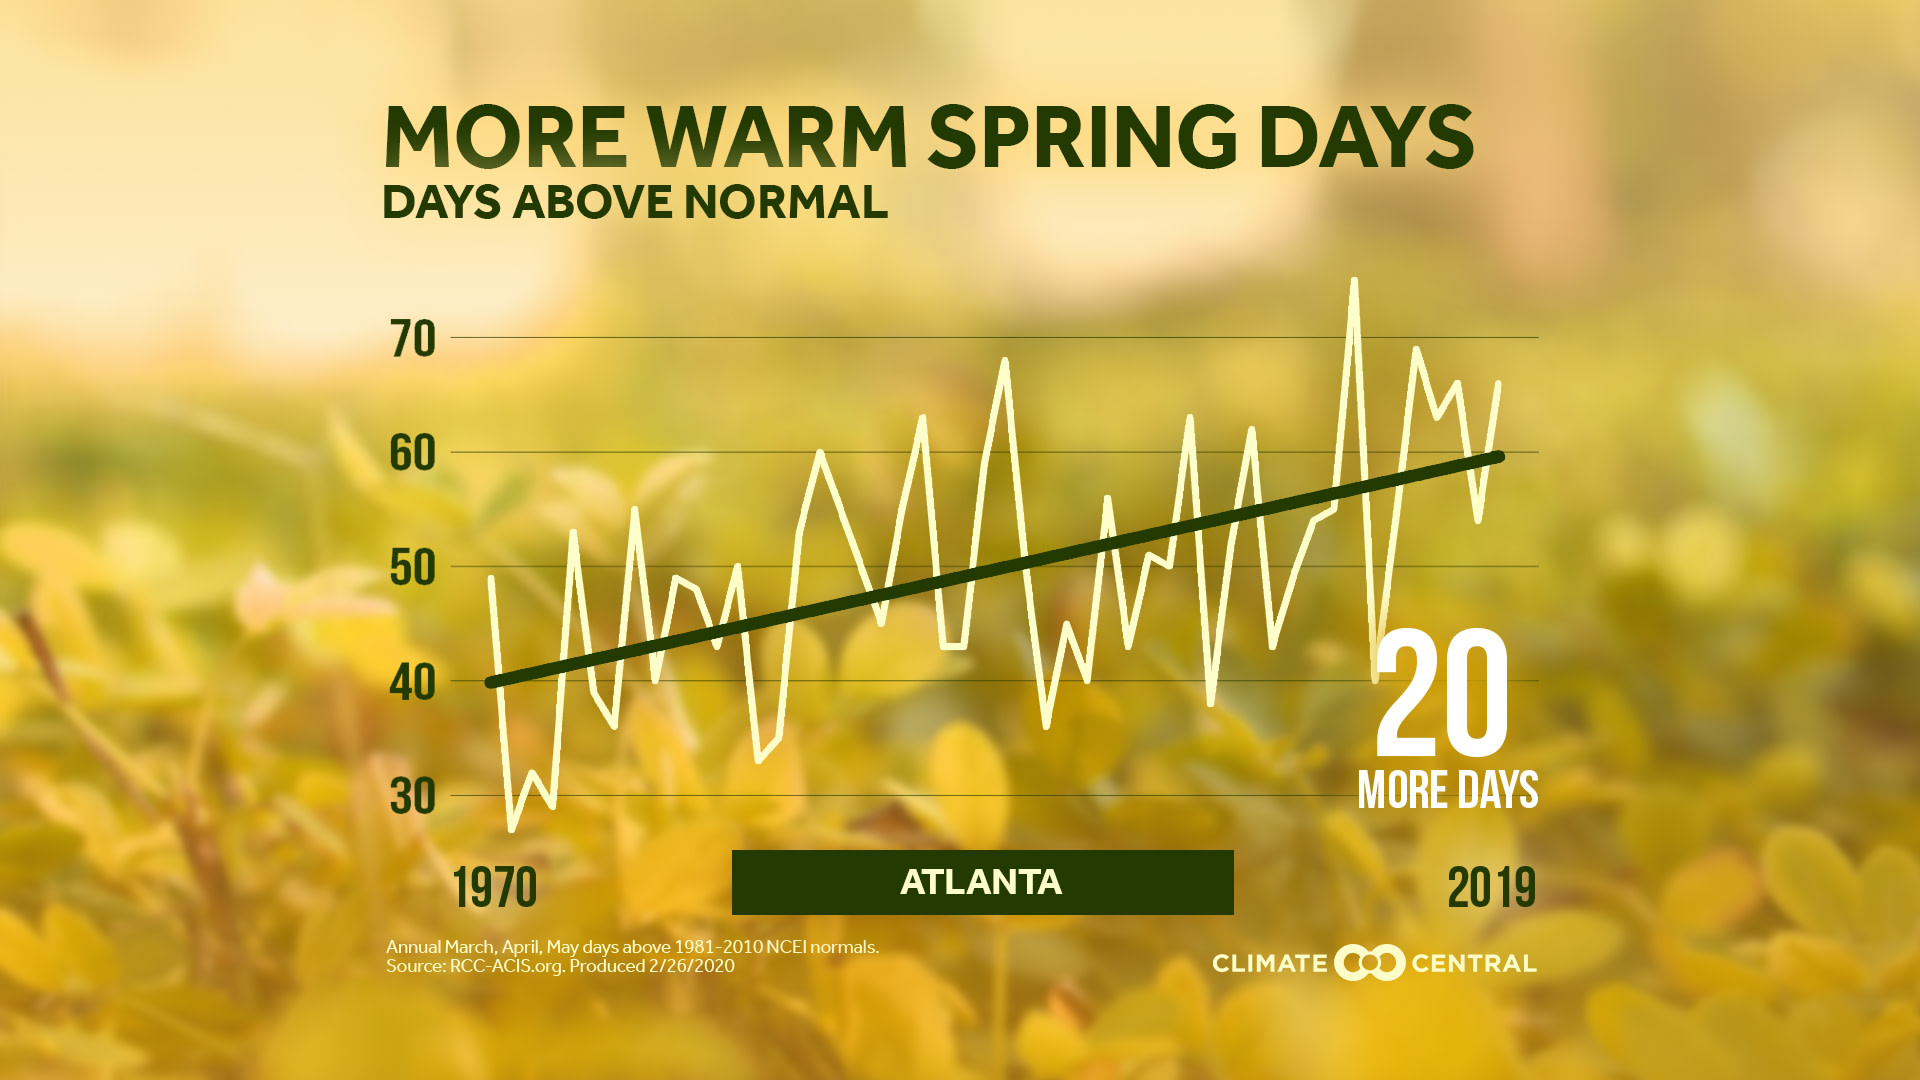
Spring Days Above Normal, and
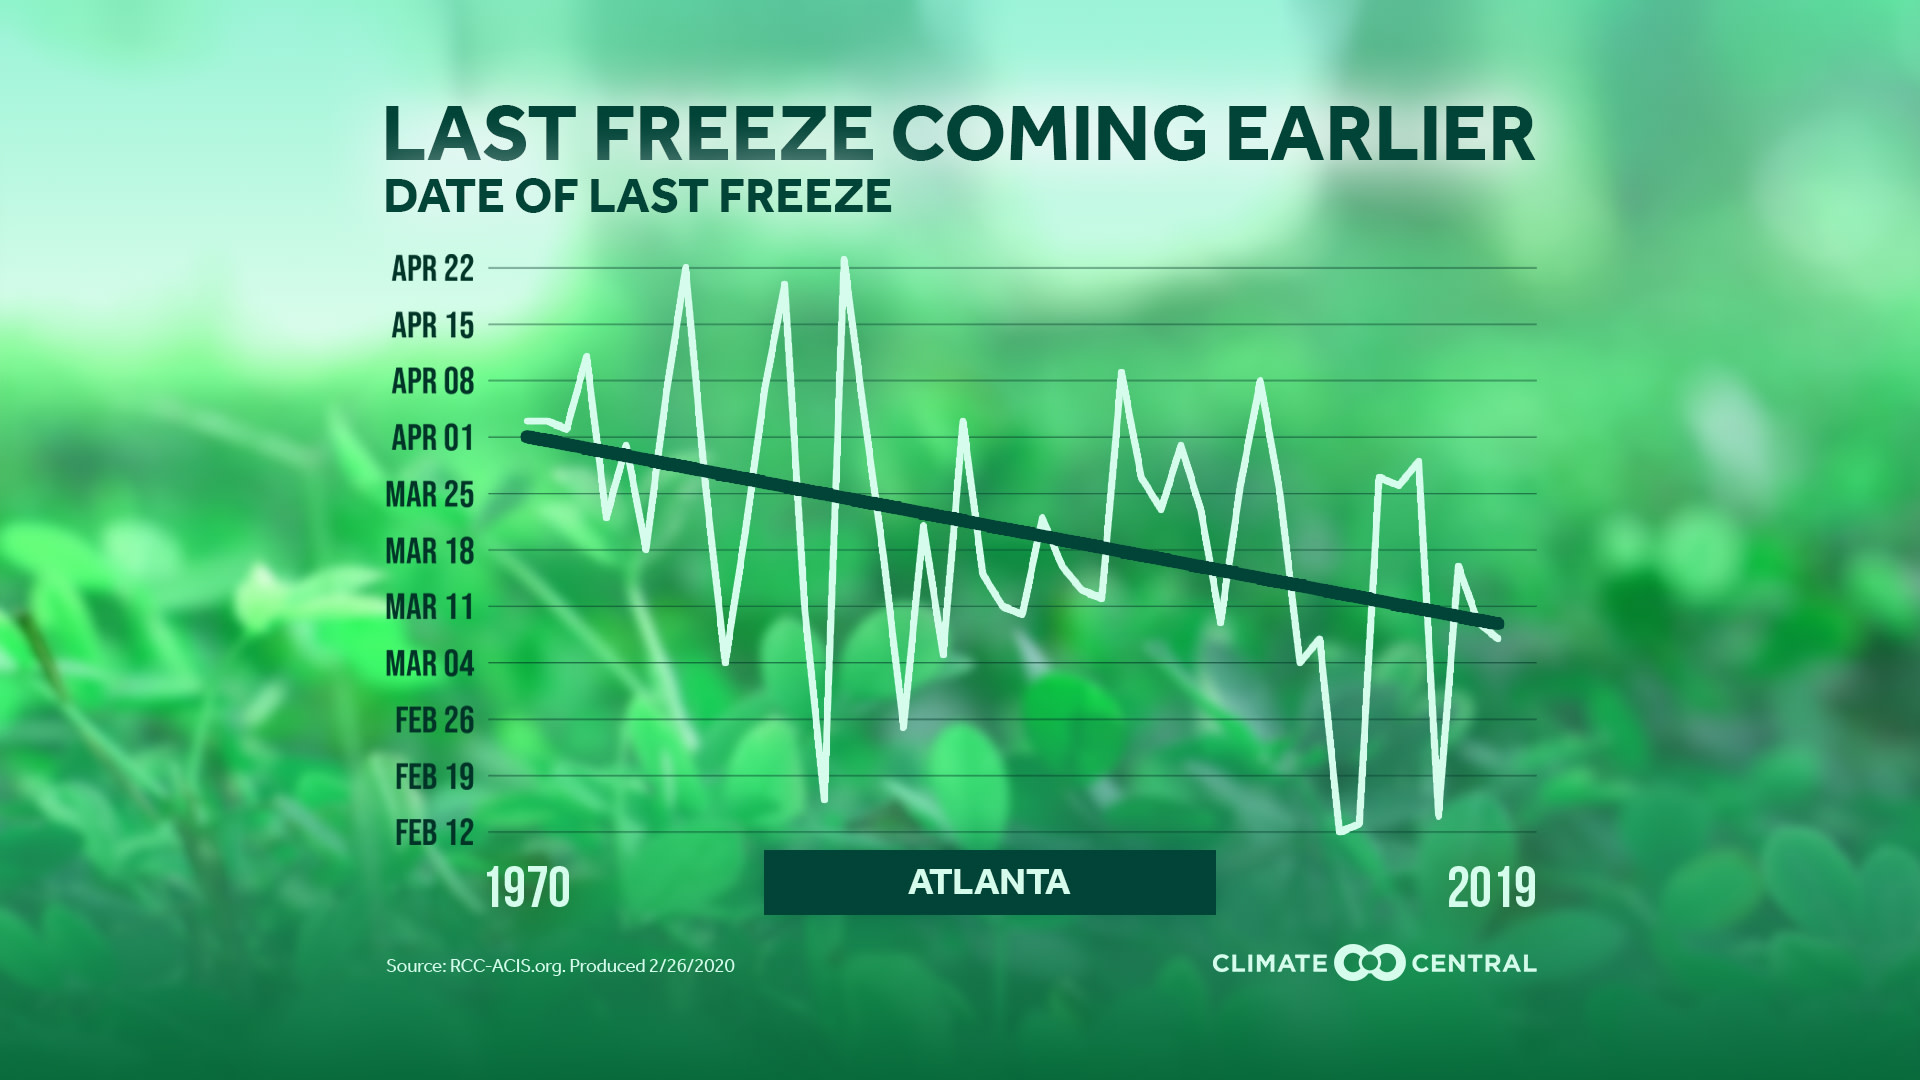
Average Date of Last Freeze
Last Freeze
Local Market Versions Available (limited)
Find Images for Your Market Here (JPG & PNG)
National Map
Continental United States
Find All Image Types Here (JPG & PNG)
Analyzing average spring temperatures since 1970, the top increases occurred in the Southwest—where spring is thefastest warming season. Reno, Nev. topped the list with an increase of 7.2°F, followed by Las Vegas, Nev. (6.4°F), El Paso, Texas (5.8°F), and Tucson (5.8°F). In general, 81% (197) of the 242 cities analyzed warmed by at least 1°F over the past fifty years. The Southwest also saw the greatest jump in the number of spring days above normal, with 79% (191 of 242) of cities recording an increase of 5 or more days.
The last freeze is an important marker of the beginning of the growing season—when plants emerge from their protective phase of winter dormancy in order to grow, develop flowers and reproduce. Our analysis of 195 cities showed that 80% (156) are experiencing their average last freeze earlier in the season, with 54% (105) recording that shift by more than a week earlier than 50 years ago.
More days above freezing has led to a longer growing season, which in turn means a longer allergy season. Seasonal allergies are one of the most common chronic conditions in the U.S., with as many as 1 in 6 Americans affected by them. Not only are the symptoms miserable to deal with, but treating them costs the U.S. an eye-watering sum of money—between $2 and $5 billion annually. Similarly, a longer growing season also means longer pest seasons. Warmer, more humid air makes for more favorable conditions for mosquitoes and even changes in behavior of ticks. Warming spring temperatures can also interfere with the timing (phenology) of important natural events such as hibernation, bird migration, and pollination. We’ll be covering spring phenology in more detail next week.
In a changing climate, the cultural hallmarks of our favorite seasons are being altered. Working to address climate change by lowering greenhouse gas emissions is one important way that we can turn over a new leaf and protect our natural world in the coming decades.
METHODOLOGY:Analyses used 1970-2019 data from the Applied Climate Information System. Locations without a consistent freezing season (defined as fewer than 30 annual nights of sub-freezing temperatures) were excluded from the last-freeze analysis. The number of spring days above normal was calculated using the 1981-2010 NOAA/NCEI normals.
Displayed trend lines are based on a mathematical linear regression. Climate Central's local analyses include 244 stations. However, for data summaries based on linear trends, only 242 stations are included due to large data gaps in St. Johnsbury, Vt. and Wheeling, W. Va.