Climate Matters•June 1, 2020
2020 Hurricane Season
KEY CONCEPTS
Atlantic hurricane season starts June 1, and experts predict that the 2020 season could be an active one
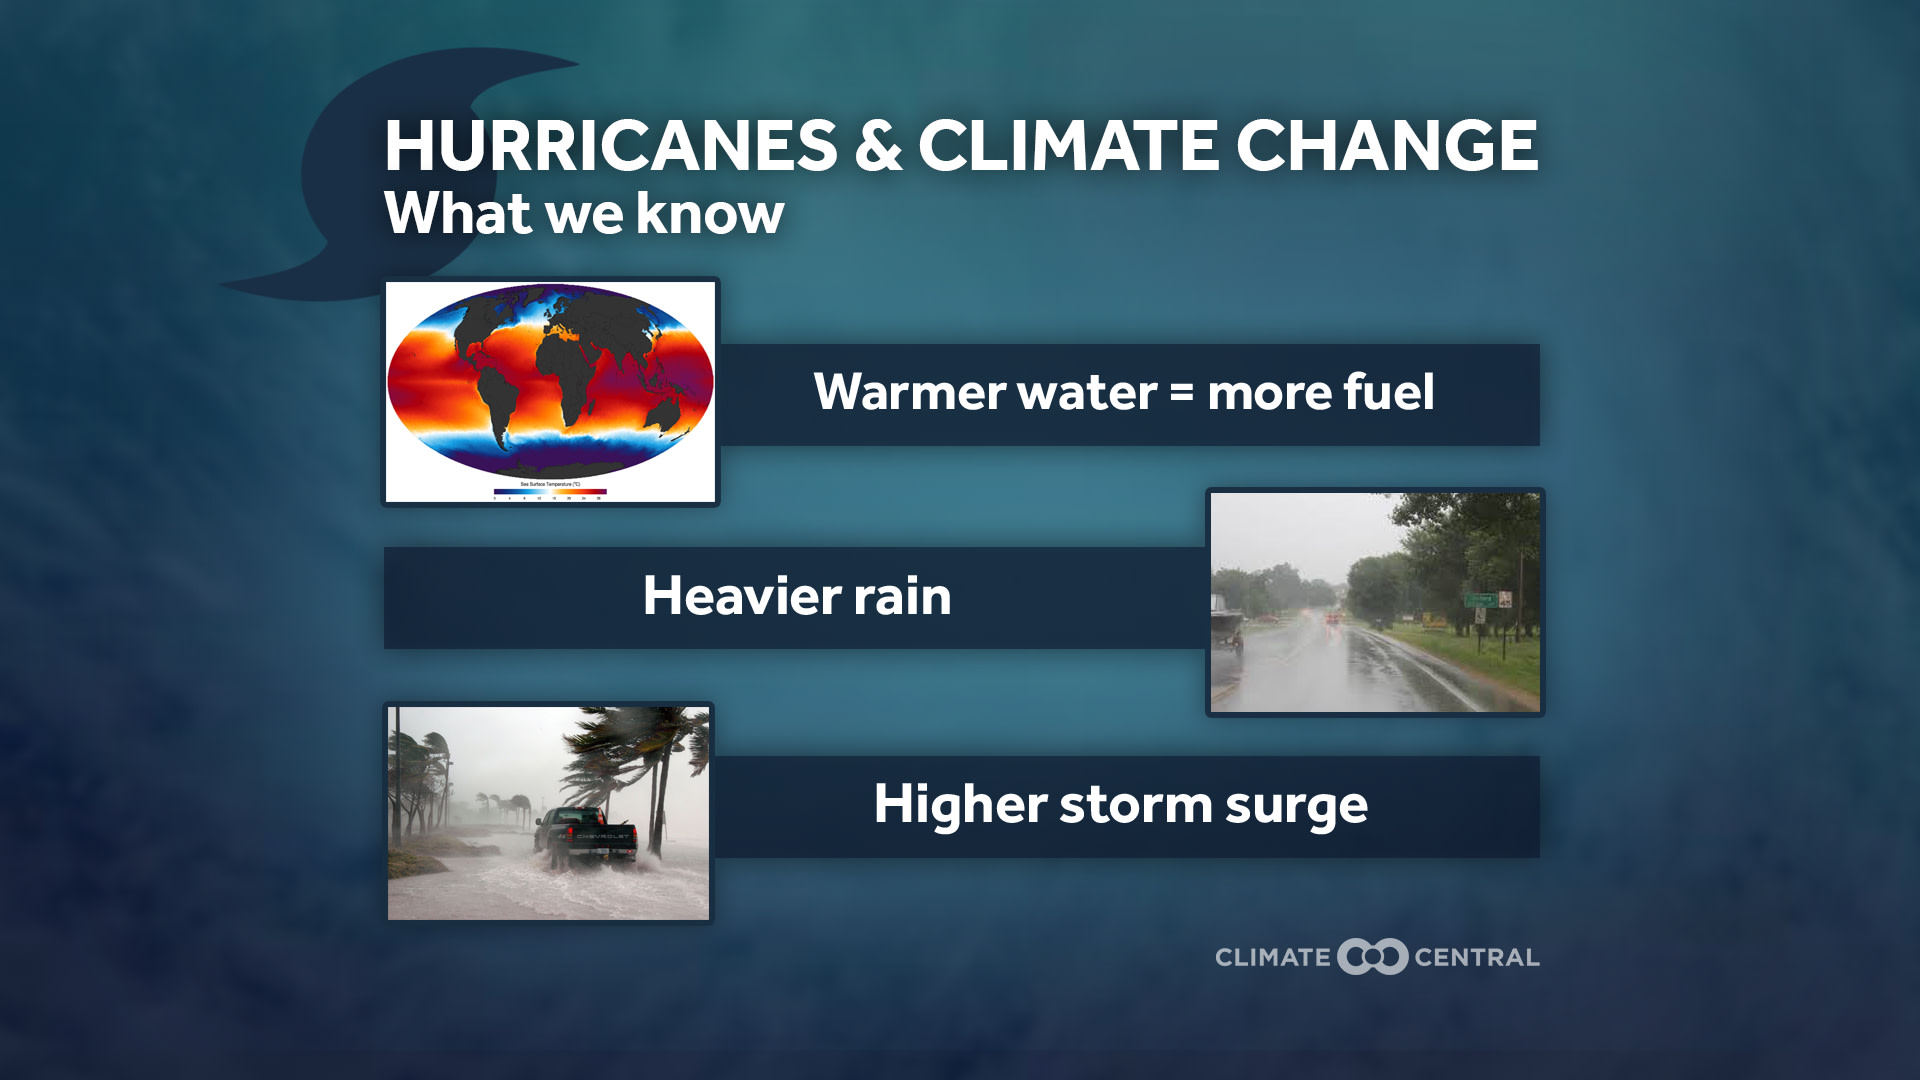
The effect of climate change on hurricanes is complicated, but research shows rising temperatures are causing hurricanes to become more intense, produce more rainfall, and cause higher storm surges.
Climate Central talked with experts on how preparations for hurricane season and recovery from storm damage are being complicated by COVID-19 and the need to maintain social distancing.
READY-TO-USE GRAPHICS

Hurricane season in the Atlantic starts June 1, although for the sixth year in a row, the first named storm of the season formed prior. Forecasters at NOAA and other experts are predicting a more active than normal hurricane season for 2020.
Hurricanes get most of their energy from warm water and water temperatures are warmer-than-average in the Atlantic and Gulf of Mexico.
Also, the El Niño-Southern Oscillation (ENSO) cycle, a naturally occurring cycle in the Pacific, which helps to predict the severity of a hurricane season is predicted to have ENSO-neutral conditions this summer and fall (with La Niña potentially forming later in the year). These conditions favor Atlantic hurricane formation because the increased vertical windshear capable of ripping apart budding hurricanes, typically supplied by El Niño, will be absent.
While climate change may not increase the frequency of hurricanes, it intensifies their impact. Research shows the proportion of strong hurricanes (Category 4 and 5 storms) has increased by 25-30% per degree Celsius of warming, and similar increases are projected in the future.
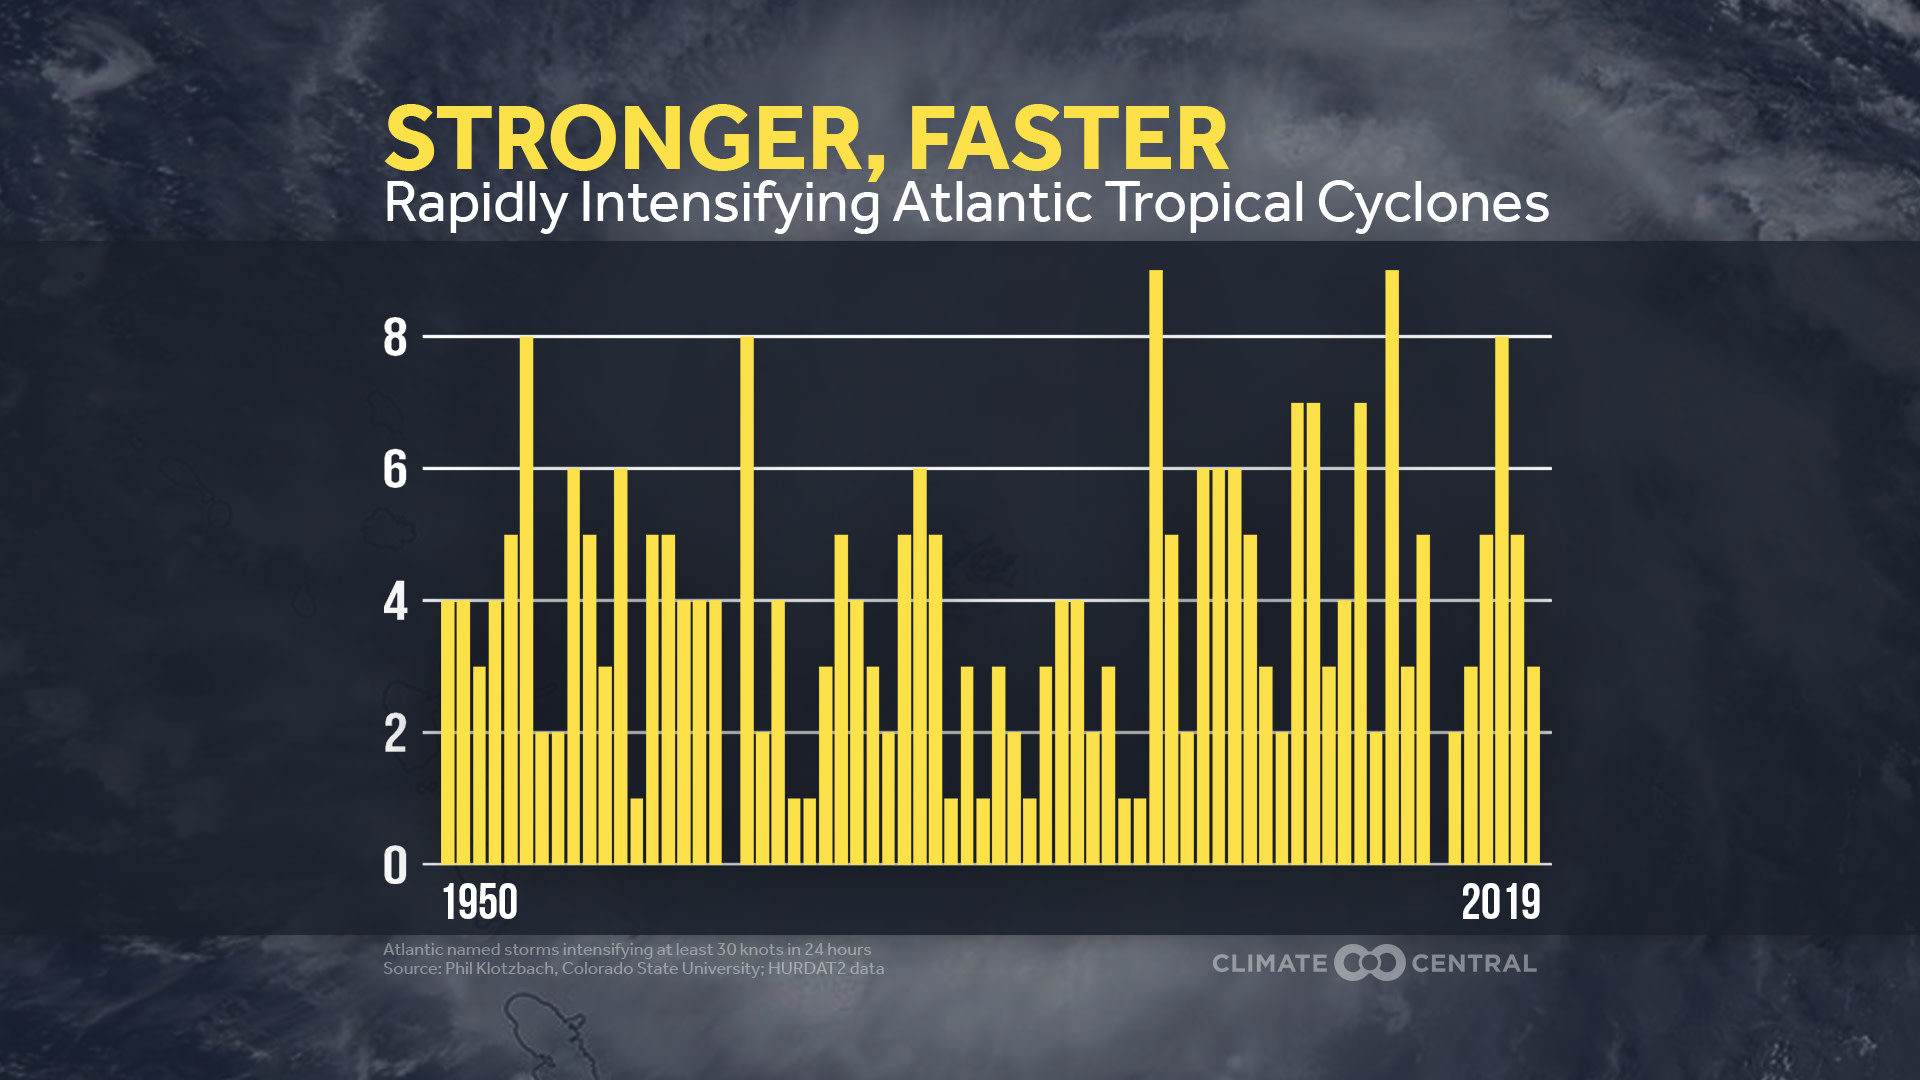
Climate change may also contribute to hurricanes’ more rapid intensification (an increase in wind speed of at least 35 mph in 24 hours), as observed in recent decades. Rapid intensification can make hurricanes more dangerous, leaving coastal residents little time to prepare for or evacuate from a strengthening storm. Damage from hurricanes increases logarithmically with wind speed, meaning a small increase in wind speed causes a much larger increase in the damage potential of a storm. For example, a 95 mph hurricane can produce nearly seven times more damage than a 75 mph hurricane.
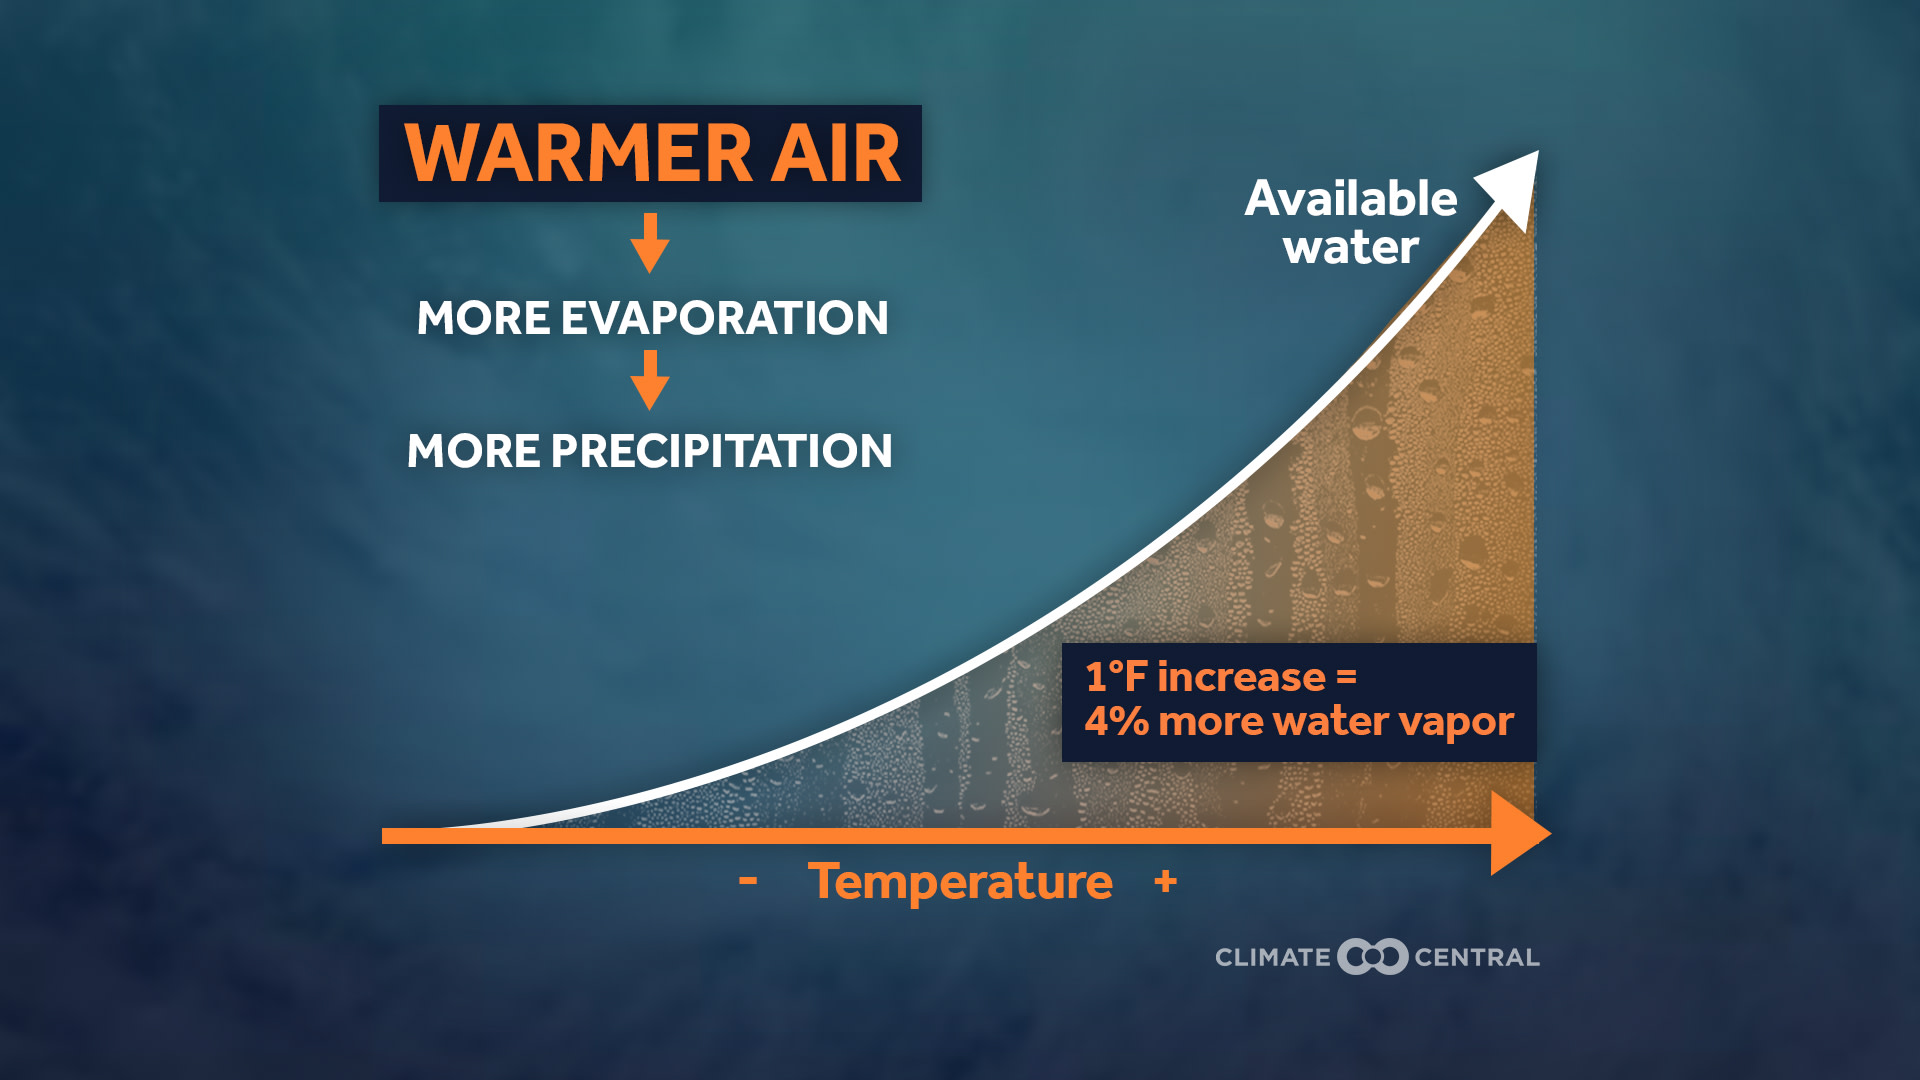
In addition to increasing the severity of storms, global warming increases rainfall. Warmer air can hold more moisture (for every 1°F increase in temperature, the air can hold 4% more water). Recent studies have found that the heavy rainfall which made hurricanes Harvey and Maria so destructive was made significantly more likely by human-caused warming.
Finally, storm surges are getting a boost from a higher, rising sea. Global mean sea level has already risen almost a foot above pre-industrial levels and could rise another one-to-eight feet by the end of the century, depending on greenhouse gas emissions. Storm surge is the leading cause of loss of life during hurricanes, causing half of all fatalities from hurricanes making landfall in the U.S.
RESOURCES FOR COVERING HURRICANES
When a storm surge is projected for your area, Climate Central’s Risk Finder tool allows you to explore the populations, properties, and infrastructure at risk. Following a storm’s damage, many communities and individuals are faced with questions about rebuilding and relocating. Our Coastal Risk Screening Tool allows users to view U.S. and global coastal locations threatened by sea level rise and coastal flooding now and in the future.
Other resources:
FEMA’s Ready.Gov Hurricanes site and COVID-19 Pandemic Operational Guidance for the 2020 Hurricane Season
CDC:Preparing for Hurricanes During the COVID-19 Pandemic | Hurricanes
NATIONAL AND REGIONAL EXPERTS
Jhordanne Jones, Doctoral Candidate, Department of Atmospheric Science, Colorado State University Tropical Meteorology Project, Jhordanne.Jones@colostate.edu
Phil Klotzbach, Research Scientist, Department of Atmospheric Science, Colorado State University Tropical Meteorology Project, Philk@Atmos.ColoState.edu
Jamie Rhome, Storm Surge Specialist/Team Lead, National Hurricane Center, jamie.r.rhome@noaa.gov
Ada Monzón, AMS Fellow and Chief Meteorologist, WAPA-TV, WKAQ, San Juan (available for interviews in Spanish and English), ada.monzon@ecoexploratorio.org
Dr. Samantha Montano, Assistant Professor of Emergency Management, Massachusetts Maritime Academy, samanthaLmontano@gmail.com
ARTICLES ON COVID AND HURRICANE SEASON
Pandemic: Virus hospitals occupy flood zones despite warnings, by Thomas Frank, E&E News
Hurricane Season on Top of a Pandemic Will Be a Nightmare, by Yessenia Funes, Gizmodo
The Looming Hurricane Season and COVID-19 Coronavirus, by Marshall Shepherd, Forbes
Coronavirus pandemic threatens to suffocate U.S. hurricane response, by Matthew Lavietes, Thomson Reuters Foundation
COVID-19 slows Hurricane Florence recovery in North Carolina, by Adam Wagner, Raleigh’s News & Observer
FEMA seeks to limit evacuations, countering past advice, by Thomas Frank, E&E News
NOAA forecasts above active Atlantic hurricane season for 2020, by Alex Harris, Miami Herald
Changes for 2020 Atlantic hurricane season: New storm surge map, 60-hour forecast message, by Mark Schleifstein, NOLA.com
METHODOLOGY
Special thanks to Dr. Phil Klotzbach of the Colorado State Tropical Meteorological Project for assistance.
A Rapid Intensification period (RI) is defined by the National Hurricane Center as an increase in the maximum sustained wind speed of at least 30 knots (approx 35 mph) in 24 hours. Hurricane data were collected from the HURDAT2 dataset and intensity of storms was analyzed at synoptic times (00, 06, 12, 18 GMT). Only storms that had reached tropical storm status were considered for the rapid intensification analysis and subtropical systems were excluded. Because of limitations in detection (before satellite and aircraft reconnaissance), HURDAT2 data before 1950 were excluded in this analysis.